|

Brent Price Analysis: Oil hits two-month high

  • Brent hits over a two-month high price of $44 per barrel. 
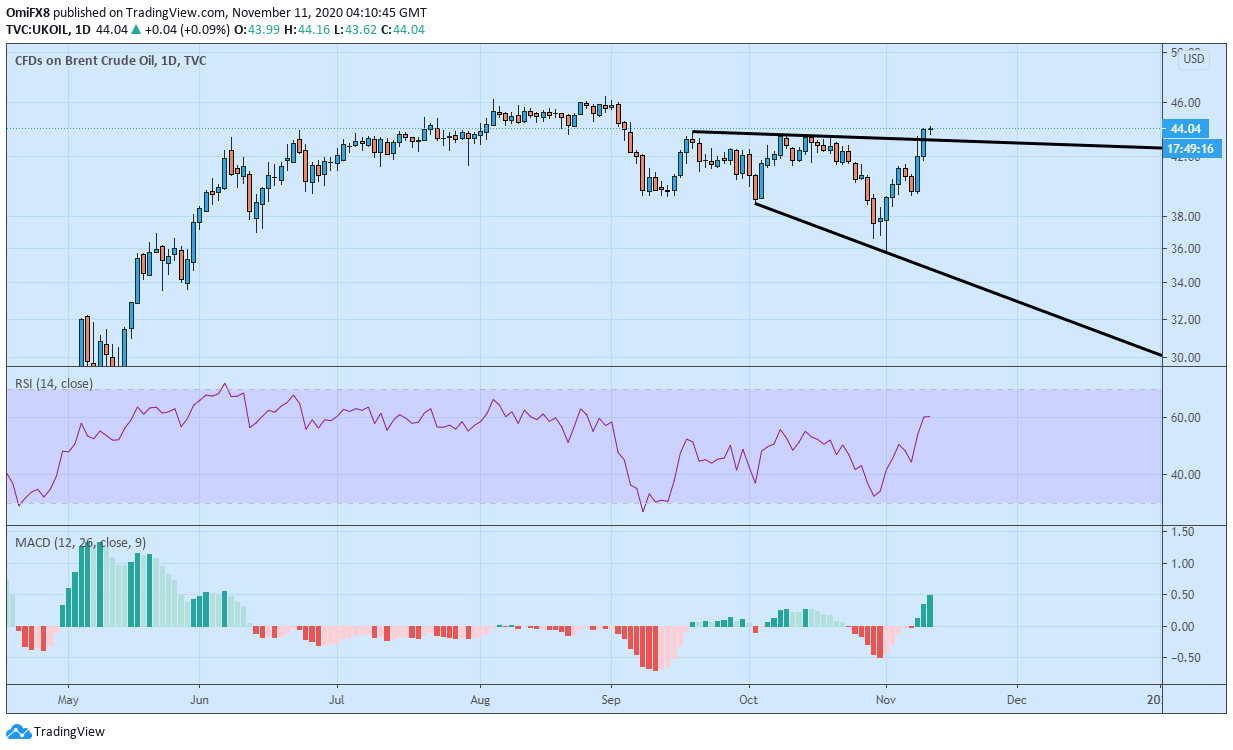
  • The daily chart shows a bullish channel breakout. 

Oil prices reached two-month highs a few minutes before the press time, extending the weekly gain on optimism generated by the US drugmaker Pfizer's disclosure of positive results of its coronavirus vaccine. 

Brent crude rose to $44.16, the highest level since Sept. 4. 

The move comes a day after the black gold advanced 4.76%, confirming an upside break of the channel pattern represented by trendlines Sept. 18 and Oct. 9 highs and Oct. 2 and Nov. 2 low and opening the doors for a re-test of the Aug. 31 high of $46.50. 

The breakout is backed by an above-50 or bullish reading on the 14-day relative strength index. Further, the MACD histogram is printing higher bars above the zero line, indicating a strengthening of the upward momentum. 

The bullish bias would be invalidated if oil ends Wednesday below $41.72 (Tuesday's low). 

Daily chart

Trend: Bullish

Technical levels

Brent Oil

Overview
Today last price44.16
Today Daily Change0.50
Today Daily Change %1.14
Today daily open43.72
 
Trends
Daily SMA2041.37
Daily SMA5041.75
Daily SMA10042.89
Daily SMA20040.54
 
Levels
Previous Daily High43.82
Previous Daily Low41.96
Previous Weekly High41.64
Previous Weekly Low35.85
Previous Monthly High43.76
Previous Monthly Low37.31
Daily Fibonacci 38.2%43.11
Daily Fibonacci 61.8%42.67
Daily Pivot Point S142.51
Daily Pivot Point S241.3
Daily Pivot Point S340.64
Daily Pivot Point R144.37
Daily Pivot Point R245.03
Daily Pivot Point R346.24

Author

Omkar Godbole

Omkar Godbole

FXStreet Contributor

Omkar Godbole, editor and analyst, joined FXStreet after four years as a research analyst at several Indian brokerage companies.

More from Omkar Godbole
Share:

Editor's Picks

EUR/USD holds above 1.1750 after mixed EU PMI data

EUR/USD manages to hold above 1.1750 but struggles to gather recovery momentum on Friday, following the mixed February PMI figures from Germany and the Eurozone. In the second half of the day, Q4 GDP, December inflation and February PMI data from the US will be watched closely by market participants.

GBP/USD recovers further toward 1.3500 after UK PMI data

GBP/USD is recovering ground further toward 1.3500 in European trading on Friday, helped by a modest uptick in the Pound Sterling after stronger-than-expected UK January Retail Sales and February PMI data. However, the pair's further upside could be limited amid persistent US Dollar strength as the focus turns to key US data. 

Gold sticks to positive bias above $5,000 ahead of US data

Gold gains some positive traction for the third consecutive day on Friday. holding above $5,000. Traders now look forward to the key US macro releases – the Advance Q4 GDP report and the Personal Consumption Expenditures (PCE) Price Index – for fresh trading impetus. 

US GDP growth expected to slow down significantly in Q4 after stellar Q3 

The United States Bureau of Economic Analysis will publish the first preliminary estimate of the fourth-quarter Gross Domestic Product at 13:30 GMT. Analysts forecast the US economy to have expanded at a 3% annualized rate, slowing down from the 4.4% growth posted in the previous quarter.

Iran tensions and AI fears at the forefront ahead of key US data

Thursday’s scorecard shows major US Stock benchmarks closed modestly in the red amid mounting US-Iran tensions and AI disruption worries. The S&P 500 shed 19 points (0.3%) to 6,861, the Nasdaq 100 lost 101 points (0.4%) to 24,797, and the Dow Jones Industrial Average dropped 267 points (0.5%) to 49,395.

Official Trump price approaches breakout with mixed signals from traders

Official Trump (TRUMP) is trading at $3.50 at the time of writing, approaching its upper consolidation range. A breakout from this range could open the door for an upside move. On-chain data shows market indecision, with balanced flows between bulls and bears, signaling a lack of clear directional bias.