Bajaj Auto Indian Elliott Wave technical analysis [Video]
![Bajaj Auto Indian Elliott Wave technical analysis [Video]](https://editorial.fxsstatic.com/images/i/Equity-Index_Nasdaq-2_XtraLarge.jpg)
Bajaj Auto Elliott Wave technical analysis
Function: Counter Trend (Minor degree, Grey).
Mode: Corrective.
Structure: Impulse within larger degree corrective structure.
Position: Minor Wave 2 Grey.
Details: Minor Wave 2 seem to be underway around 10000 mark.
Invalidation point: 12900.
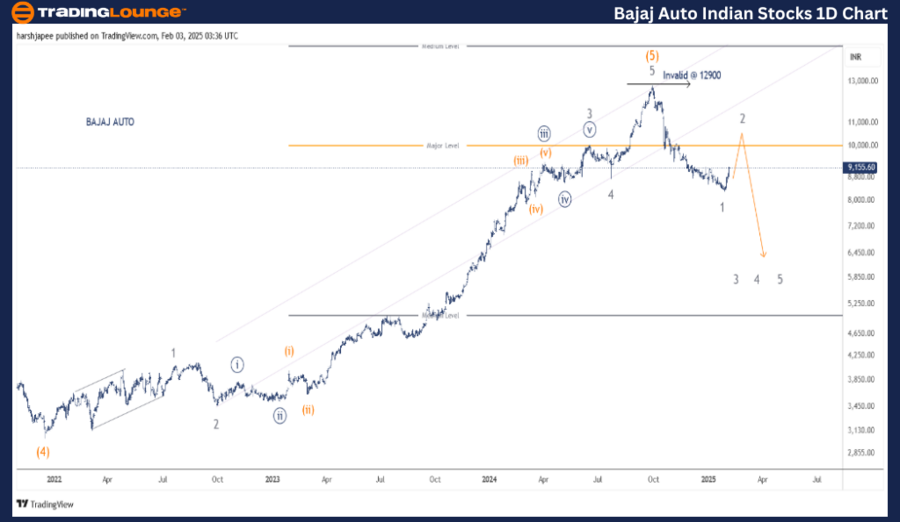
Bajaj Auto daily chart technical analysis and potential Elliott Wave counts
BAJAJ AUTO daily chart in indicating a major top in place around the 12900 mark. The stock has dropped through 8400 mark as an impulse Wave 1 and is now correcting higher towards 10000 mark to terminate Minor Wave 2 before bears are back in control.
The stock had dropped to 3030 mark in December 2021, terminating Intermediate Wave (4) Orange as seen on the chart. The rally thereafter has been an impulse, sub dividing into five waves at Minor degree through 12900 mark.
Further, the stock has reversed lower to carve a corrective wave at a larger degree against 12900 highs. The sub waves are Minor Wave 1 in place around 8400 mark followed by Wave 2, which is now underway. If the above is correct, we should witness Wave 3 lower soon.
Bajaj Auto Elliott Wave technical analysis
Function: Counter Trend (Minor degree, Grey).
Mode: Corrective.
Structure: Impulse within larger degree corrective structure.
Position: Minor Wave 2 Grey.
Details: Minor Wave 1 Grey was an impulse sub dividing into five waves at Minute Degree, which terminated around 8345. Minor Wave 2 seem to be underway now around 10000 mark.
Invalidation point: 12900.
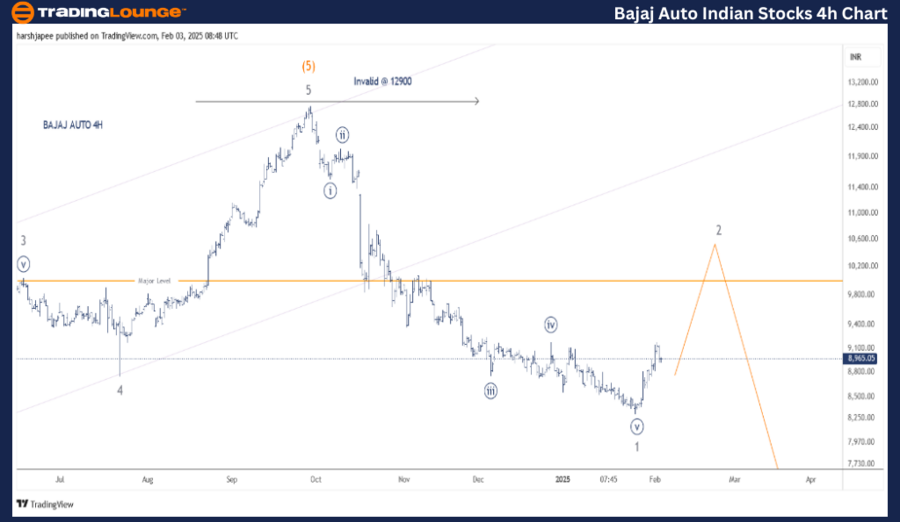
Bajaj Auto four-hour chart technical analysis and potential Elliott Wave counts
BAJAJ AUTO 4H chart is highlighting the sub waves after Minor Wave 3 of the larger degree trend higher terminated around 10070 mark. Minor Wave 4 terminated around 8775 in July 2024 followed by an impulse Wave 5 through 12900 levels before turning lower.
The drop has been impulse Wave 1, terminating just below the 8400 mark. Bulls are carving a corrective Wave 2 higher towards the 10000 mark before Wave 3 could resume lower again.
Conclusion
BAJAJ AUTO is carving Minor Wave 2 potentially towards 10000 mark before turning lower again.
Bajaj Auto Indian Elliott Wave technical analysis [Video]
Author

Peter Mathers
TradingLounge
Peter Mathers started actively trading in 1982. He began his career at Hoei and Shoin, a Japanese futures trading company.


