US Dollar Index churns near 97.00 on Thursday
- The US Dollar Index treads water near 96.92 ahead of Friday's delayed Consumer Price Index release
- Strong January payrolls keep Federal Reserve rate cut expectations pushed out to mid-2026

The Federal Reserve (Fed) held rates at 3.50% to 3.75% at its January 28 meeting, pausing after three consecutive quarter-point cuts in 2025. Two Federal Open Market Committee (FOMC) members dissented in favor of a cut, but Chair Powell pointed to an improved growth outlook and signs of labor market stabilization as reasons to wait. Wednesday's Nonfarm Payrolls (NFP) report reinforced that stance, with January payrolls rising by 130K, the largest gain in over a year, while the unemployment rate fell to 4.3%. The stronger-than-expected data pushed Treasury yields higher and prompted markets to delay the next expected rate cut from June to July, with less than a 5% probability assigned to a March move. Interest rate swaps now show roughly 49 basis points of easing priced through December, down from 59 basis points before the jobs report.
The delayed January Consumer Price Index (CPI), rescheduled to Friday, following a brief government shutdown, is the next key catalyst. Economists expect headline CPI to ease to 2.5% year-over-year from December's 2.7%, and any surprise in either direction could reshape the near-term rate path. Meanwhile, the US Dollar is also contending with renewed Japanese Yen strength driven by verbal intervention from Japanese authorities and optimism around Prime Minister Takaichi's expansionary fiscal agenda.
1H chart shows range-bound price action below the 200 EMA
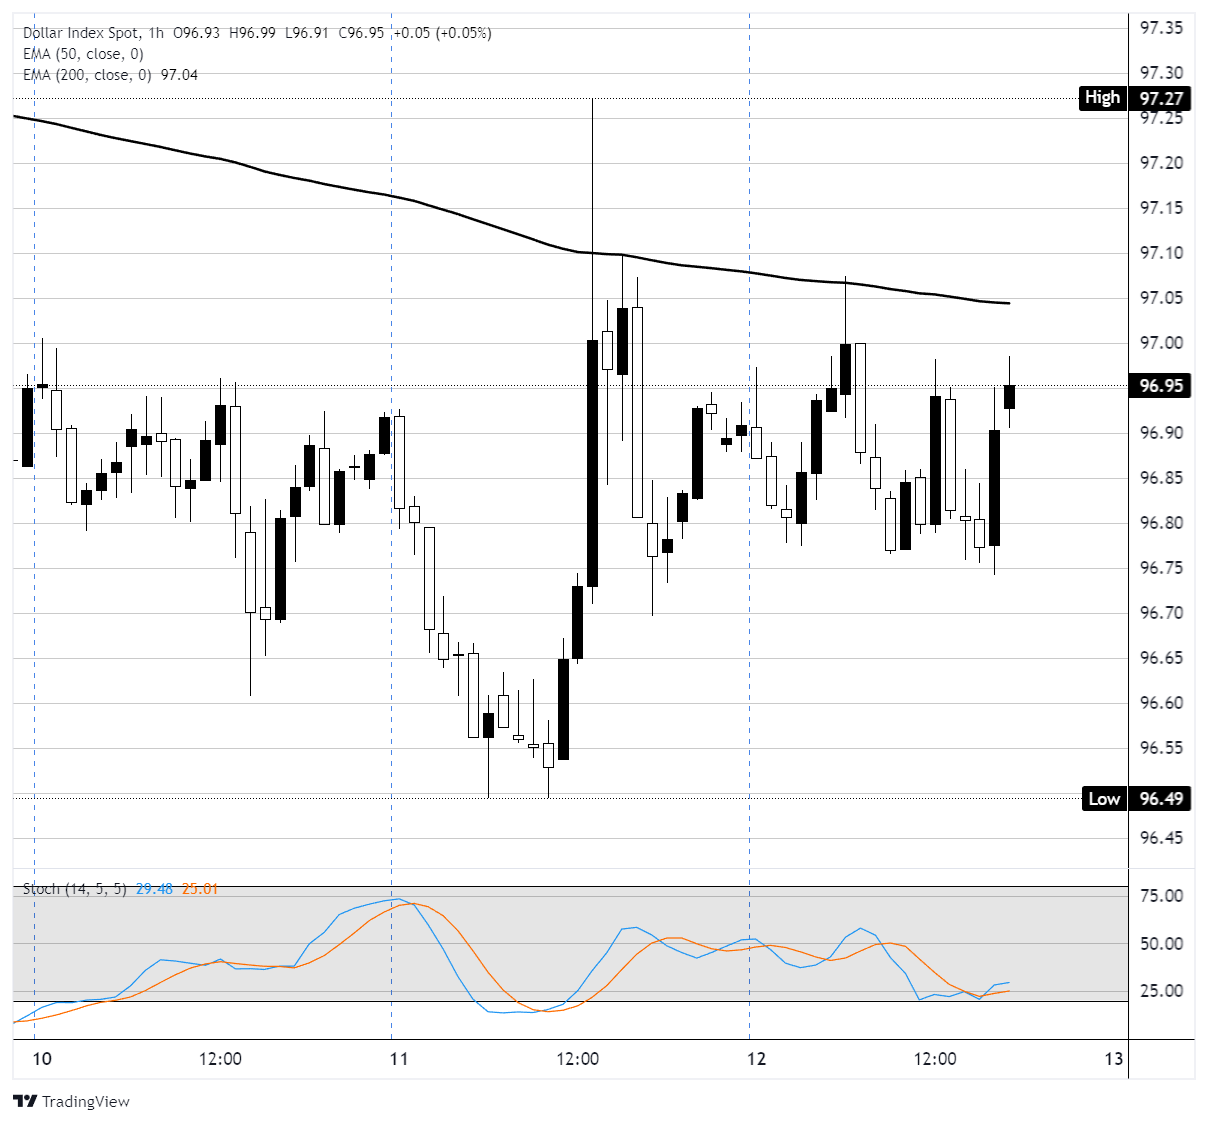
On the 1-hour chart, the Dollar Index is trading at 96.92, pinned just below the 200-period Exponential Moving Average (EMA) at 97.04, which is acting as dynamic resistance and capping intraday rallies. The session high at 97.27 marked a rejection from that zone early on Wednesday before price sold off sharply toward the session low at 96.49, forming a wide-range reversal candle. Thursday's price action has been choppy and contained between 96.80 and 96.95, with no clear directional follow-through. The 50 EMA is flat and converging toward price from above, suggesting compressed momentum. Immediate support sits at 96.80, the base of Thursday's consolidation, with a break lower exposing the 96.49 session low. Below that, the 96.43 area aligns with a broader overlap support and the 61.8% Fibonacci retracement level noted on higher timeframes. To the upside, a sustained close above 97.04 would be needed to challenge the 97.27 high. The Stochastic Oscillator (14, 5, 5) is tilting into oversold conditions, though no bullish crossover has formed yet. A bullish cross in oversold territory would signal a potential short-term bounce toward the 200 EMA. Price needs to reclaim and hold above 97.04 to shift the intraday bias back to bullish; otherwise, the structure favors further consolidation or a retest of the 96.49 low ahead of Friday's CPI release.
DXY 1-hour chart
US Dollar FAQs
The US Dollar (USD) is the official currency of the United States of America, and the ‘de facto’ currency of a significant number of other countries where it is found in circulation alongside local notes. It is the most heavily traded currency in the world, accounting for over 88% of all global foreign exchange turnover, or an average of $6.6 trillion in transactions per day, according to data from 2022. Following the second world war, the USD took over from the British Pound as the world’s reserve currency. For most of its history, the US Dollar was backed by Gold, until the Bretton Woods Agreement in 1971 when the Gold Standard went away.
The most important single factor impacting on the value of the US Dollar is monetary policy, which is shaped by the Federal Reserve (Fed). The Fed has two mandates: to achieve price stability (control inflation) and foster full employment. Its primary tool to achieve these two goals is by adjusting interest rates. When prices are rising too quickly and inflation is above the Fed’s 2% target, the Fed will raise rates, which helps the USD value. When inflation falls below 2% or the Unemployment Rate is too high, the Fed may lower interest rates, which weighs on the Greenback.
In extreme situations, the Federal Reserve can also print more Dollars and enact quantitative easing (QE). QE is the process by which the Fed substantially increases the flow of credit in a stuck financial system. It is a non-standard policy measure used when credit has dried up because banks will not lend to each other (out of the fear of counterparty default). It is a last resort when simply lowering interest rates is unlikely to achieve the necessary result. It was the Fed’s weapon of choice to combat the credit crunch that occurred during the Great Financial Crisis in 2008. It involves the Fed printing more Dollars and using them to buy US government bonds predominantly from financial institutions. QE usually leads to a weaker US Dollar.
Quantitative tightening (QT) is the reverse process whereby the Federal Reserve stops buying bonds from financial institutions and does not reinvest the principal from the bonds it holds maturing in new purchases. It is usually positive for the US Dollar.
Author

Joshua Gibson
FXStreet
Joshua joins the FXStreet team as an Economics and Finance double major from Vancouver Island University with twelve years' experience as an independent trader focusing on technical analysis.