Australia FX Today: The Aussie hangs on to China's figures

The Australian Dollar (AUD) traded slightly lower on Friday, below 0.6650 against the US Dollar (USD), losing 0.15% over the session. Caution dominates trading ahead of the weekend as traders await Monday's release of key Industrial Production and Retail Sales data from China, Australia's main trading partner.
This Forex session is thus marked by contained volatility on the AUD/USD, in contrast to Thursday's session, which was shaken by US inflation data.
If the Chinese data disappoint on Monday, they could rekindle concerns about Chinese demand for raw materials, a historic driver of the Australian Dollar, and prompt investors to reduce their exposure to the AUD.
The Chinese economy: Driving force or brake for the Aussie?
Australia's economy is structurally linked to that of China, the country's biggest customer for iron ore, coal and natural gas exports. As a result, Chinese macroeconomic data, particularly industrial production, are closely followed by Forex investors.
For August, the consensus is for annual Industrial Production growth of 5.8%, up slightly on July's 5.7%.
On the consumer front, Retail Sales are expected to rise by 3.8% YoY after 3.7% the previous month.
While these figures appear correct on the surface, they mask a weakened momentum. As Christine Peltier of BNP Paribas notes, "the battle against deflation is far from won" in China.
Weaker industrial indicators could accentuate doubts about the robustness of Chinese domestic demand. This would have a direct impact on Australia's growth prospects by reducing export volumes, commodity prices and, consequently, mining revenues. There is then a close link between Chinese statistics and the trajectory of the Australian Dollar.
The lingering shadow of Chinese deflation
Despite Chinese GDP growth of 5.3% in the first half of the year, recent signs point to a loss of momentum. In July, Industrial Production growth fell to 5.7%, its lowest level in eight months, while Retail Sales stalled at 3.7%, well below analysts' expectations.
Reuters journalists Kevin Yao and Joe Cash note that "retail sales and industrial production missed forecasts, increasing pressure on authorities to boost domestic demand."
At the same time, the Consumer Price Index (CPI) fell back into negative territory, down 0.4% in August, heightening fears of prolonged deflation.
This deflationary dynamic is not neutral for the AUD. It could prompt Chinese economic players to delay or limit their purchases of raw materials and curb industrial investment, all factors likely to weaken the Aussie, particularly against the US Dollar.
China on pause, Australia on standby
The Chinese authorities have stepped up targeted measures in an attempt to boost consumption, without announcing a massive stimulus plan. As Michelle Lam, Greater China economist at Societe Generale, points out, "the pressure to stimulate the economy may become more visible as winter approaches", reports The Business Times.
Against this backdrop, the Reserve Bank of Australia (RBA) is also on the defensive. Faced with slowing Chinese growth and falling commodity prices, it recently hinted that a prolonged pause on rates was likely, especially as Australian inflation has begun to ease.
For Forex traders, this means that the Australian Dollar's ability to recover will depend less on the RBA's decisions than on the evolution of Chinese demand and its implications for foreign trade.
Technical analysis of AUD/USD: The uptrend may lose steam
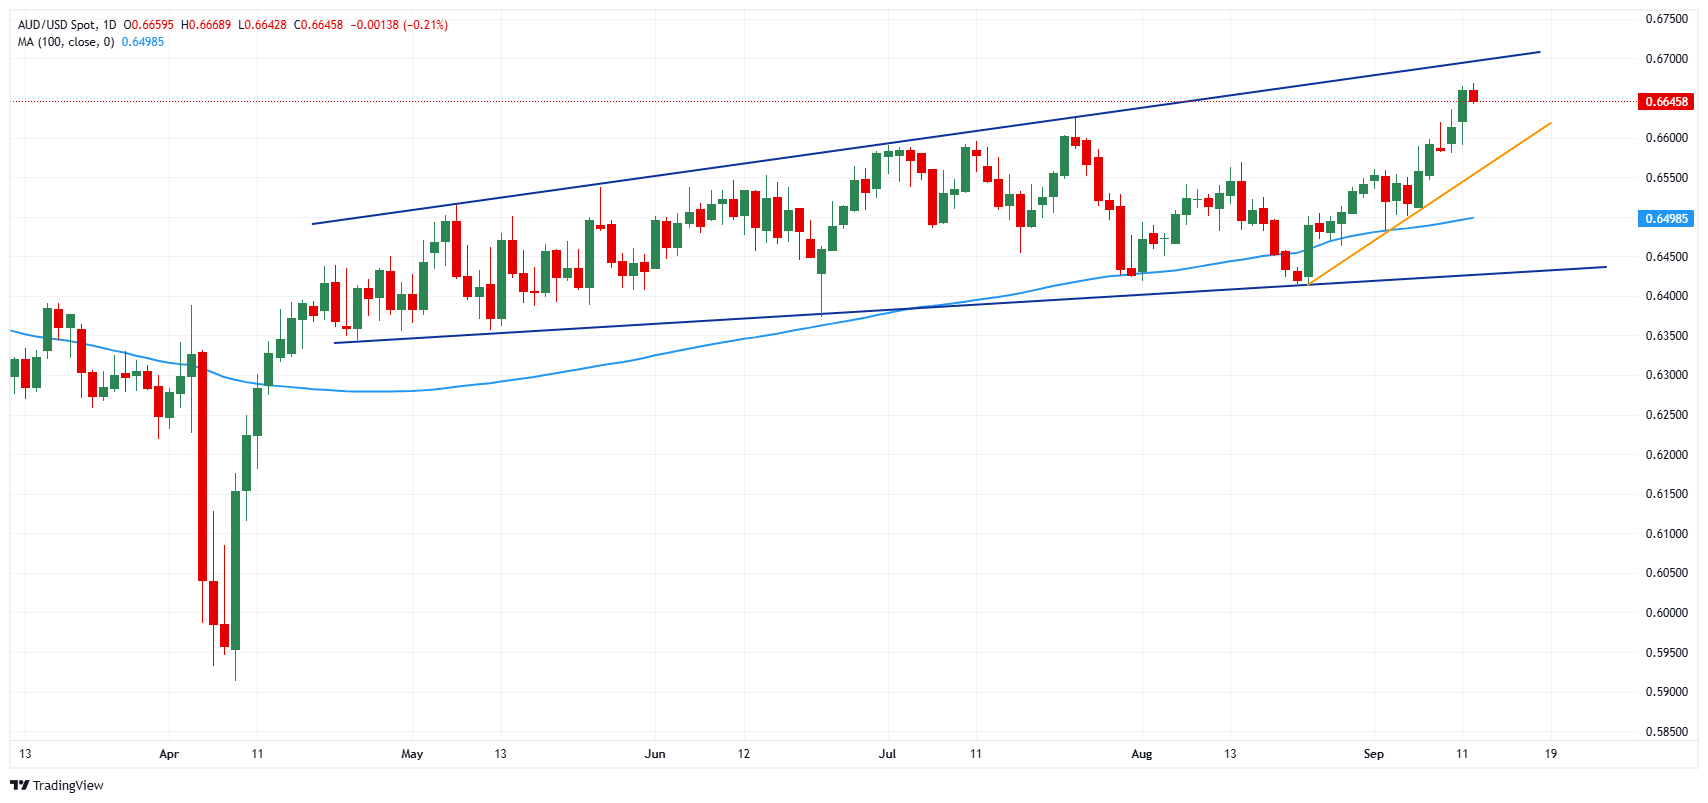
AUD/USD daily chart. Source: FXStreet.
AUD/USD corrects slightly downward on Friday but at this stage remains entrenched in an uptrend that has lasted since May.
The uptrend is following a channel whose upper limit is around 0.6700, a threshold which could block any short-term bullish attempt. Beyond this threshold, the Aussie could then seek out the 0.6800 level, which corresponds in particular to the peaks of July and August 2024.
But after the almost continuous rise since 0.6400, the risks of a bearish correction are increasing, and if Chinese data disappoints on Monday, this could encourage a drop toward the short-term trendline leading to 0.6570. That response could lead to a bearish acceleration below with the 100-day Simple Moving Average (SMA) and the lower boundary of the channel with 0.6430 in sight.
Australian Dollar Price Today
The table below shows the percentage change of Australian Dollar (AUD) against listed major currencies today. Australian Dollar was the strongest against the New Zealand Dollar.
| USD | EUR | GBP | JPY | CAD | AUD | NZD | CHF | |
|---|---|---|---|---|---|---|---|---|
| USD | 0.17% | 0.23% | 0.38% | 0.11% | 0.31% | 0.49% | 0.23% | |
| EUR | -0.17% | 0.05% | 0.21% | -0.04% | 0.15% | 0.33% | 0.06% | |
| GBP | -0.23% | -0.05% | 0.16% | -0.10% | 0.07% | 0.28% | 0.02% | |
| JPY | -0.38% | -0.21% | -0.16% | -0.26% | -0.08% | 0.06% | -0.20% | |
| CAD | -0.11% | 0.04% | 0.10% | 0.26% | 0.24% | 0.39% | 0.12% | |
| AUD | -0.31% | -0.15% | -0.07% | 0.08% | -0.24% | 0.21% | -0.09% | |
| NZD | -0.49% | -0.33% | -0.28% | -0.06% | -0.39% | -0.21% | -0.27% | |
| CHF | -0.23% | -0.06% | -0.02% | 0.20% | -0.12% | 0.09% | 0.27% |
The heat map shows percentage changes of major currencies against each other. The base currency is picked from the left column, while the quote currency is picked from the top row. For example, if you pick the Australian Dollar from the left column and move along the horizontal line to the US Dollar, the percentage change displayed in the box will represent AUD (base)/USD (quote).
Author

Ghiles Guezout
FXStreet
Ghiles Guezout is a Market Analyst with a strong background in stock market investments, trading, and cryptocurrencies. He combines fundamental and technical analysis skills to identify market opportunities.


