|

AUDUSD Price Analysis: Decisive slippage below 0.6630 to strengthen H&S breakdown

  • An H&S formation has bolstered signs of a bearish reversal head.
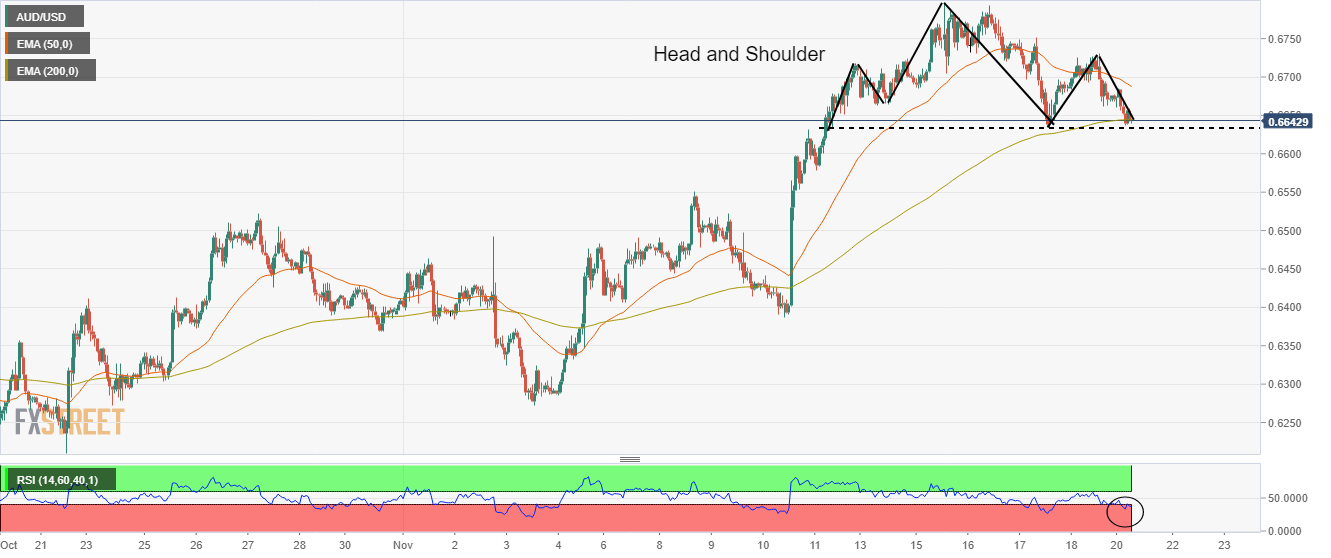
  • A test of 200-EMA indicates that the asset is at a make or a break level.
  • The RSI (14) has shifted into the bearish range of 20.00-40.00, which signals more weakness ahead.

The AUDUSD pair has dropped to near 0.6640 in the Asian session as a sheer decline in risk appetite has impacted risk-perceived assets. The asset is declining after facing barricades around 0.6720 as the US dollar index (DXY) added gains further. The DXY has refreshed its weekly high at 107.38 and is expected to add more gains ahead.

S&P500 futures have surrendered the majority of Friday’s gains in the Tokyo session. While the 10-year US Treasury yields have dropped below 3.80%.

On an hourly scale, the asset has formed a Head and Shoulder (H&S) pattern that signals a bearish reversal. The chart pattern indicates a prolonged consolidation, which results in sheer momentum after a breakdown of the neckline placed around 0.6630.

The 50-period Exponential Moving Average (EMA) at 0.6687 has tilted towards the south, which adds to the downside filters. Also, the 200-period Exponential Moving Average (EMA) has been challenged at 0.6645, which will keep the asset on the tenterhooks.

Meanwhile, the Relative Strength Index (RSI) (14) has shifted into the bearish range of 20.00-40.00, which indicates that the downside momentum has been triggered.

Going forward, a breakdown of the H&S neckline at 0.6630 would confirm the bearish reversal, which will drag the asset towards November 8 high at 0.6550, followed by November 10 low around 0.6400.

On the flip side, a break above Friday’s high at 0.6730 will negate the H&S formation and will drag the asset towards Tuesday’s high around 0.6800 and the round-level resistance at 0.6900.

AUDUSD hourly chart

AUD/USD

Overview
Today last price0.6642
Today Daily Change-0.0028
Today Daily Change %-0.42
Today daily open0.667
 
Trends
Daily SMA200.6513
Daily SMA500.6495
Daily SMA1000.6695
Daily SMA2000.6947
 
Levels
Previous Daily High0.673
Previous Daily Low0.6661
Previous Weekly High0.6798
Previous Weekly Low0.6634
Previous Monthly High0.6548
Previous Monthly Low0.617
Daily Fibonacci 38.2%0.6688
Daily Fibonacci 61.8%0.6704
Daily Pivot Point S10.6644
Daily Pivot Point S20.6618
Daily Pivot Point S30.6575
Daily Pivot Point R10.6713
Daily Pivot Point R20.6757
Daily Pivot Point R30.6783

Author

Sagar Dua

Sagar Dua

FXStreet

Sagar Dua is associated with the financial markets from his college days. Along with pursuing post-graduation in Commerce in 2014, he started his markets training with chart analysis.

More from Sagar Dua
Share:

Editor's Picks

EUR/USD softens below 1.1800 on Fed hawkish remarks

The EUR/USD pair edges lower to around 1.1775 during the early Asian session on Wednesday, pressured by a renewed US Dollar demand. Traders await the US President Donald Trump's State of the Union address later on Wednesday for clarity on fiscal policies. 

GBP/USD regains 1.3500 and above

GBP/USD extends its advance for the third day in a row on Tuesday, this time retesting the area beyond the 1.3500 hurdle. Cable’s uptick comes despite decent gains in the Greenback and the dovish message from the BoE’s Bailey at the UK Parliament.

Gold stays firm above $5,150 as Trump's delivers State of the Union speech

Gold finds fresh demand and regains the $5,150 level following the previous day's pullback from the monthly peak as traders assess Trump's State of the Union address. Trade-related uncertainties and geopolitical risks seem to act as a tailwind for the safe-haven bullion. 

Hyperliquid registers mild gains following CoinShares' ETP launch

Hyperliquid registered a 3% gain on Tuesday after CoinShares announced the launch of its Physical Hyperliquid Staking exchange-traded product, offering investors exposure to the token's price and staking yields.

The Citrini report: How a debatable AI narrative can shake Wall Street

That AI-related headline alone was enough to rattle investors.US stocks slid sharply on Monday after a widely circulated Citrini Research memo outlined a hypothetical “2028 Global Intelligence Crisis”, warning that rapid AI adoption could push US unemployment into double digits as early as by mid-2028.

XRP pressured by weak ETF flows and declining retail interest

Ripple (XRP) is edging lower, trading above its intraday low of $1.32 at the time of writing on Tuesday. The decline from its weekly opening of $1.39 reflects heightened volatility in the broader cryptocurrency market, accentuated by tariff-triggered uncertainty.