|

AUD/USD technical analysis: Aussie is under pressure below the 0.6800 handle

  • AUD/USD is consolidating the recent losses in a quiet Monday.
  • The level to beat for sellers is the 0.6760 price level.
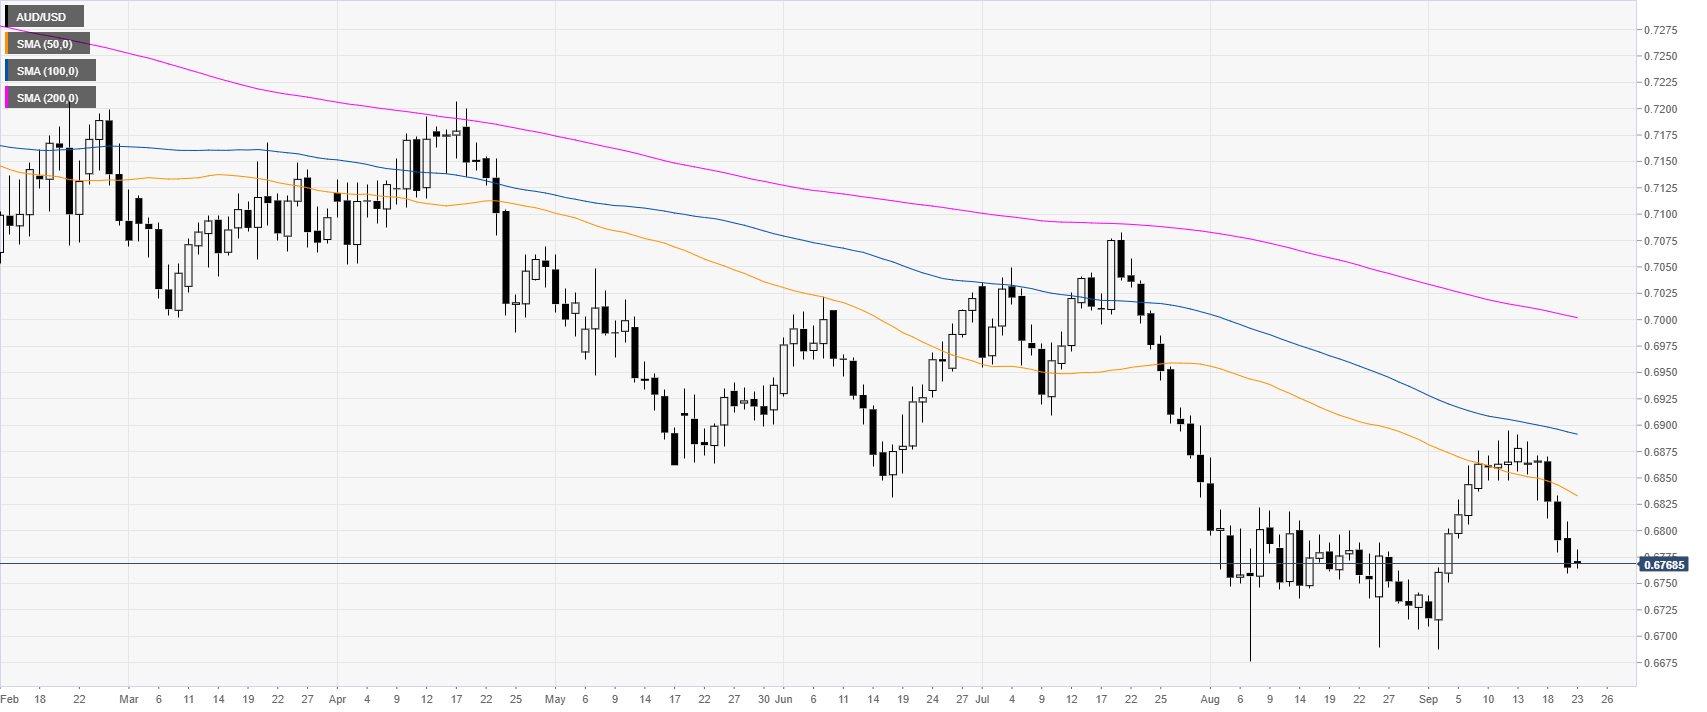
 

AUD/USD daily chart

 
AUD/USD is trading in a downtrend below its main daily simple moving averages (SMAs) as the market is trading within Friday’s range.

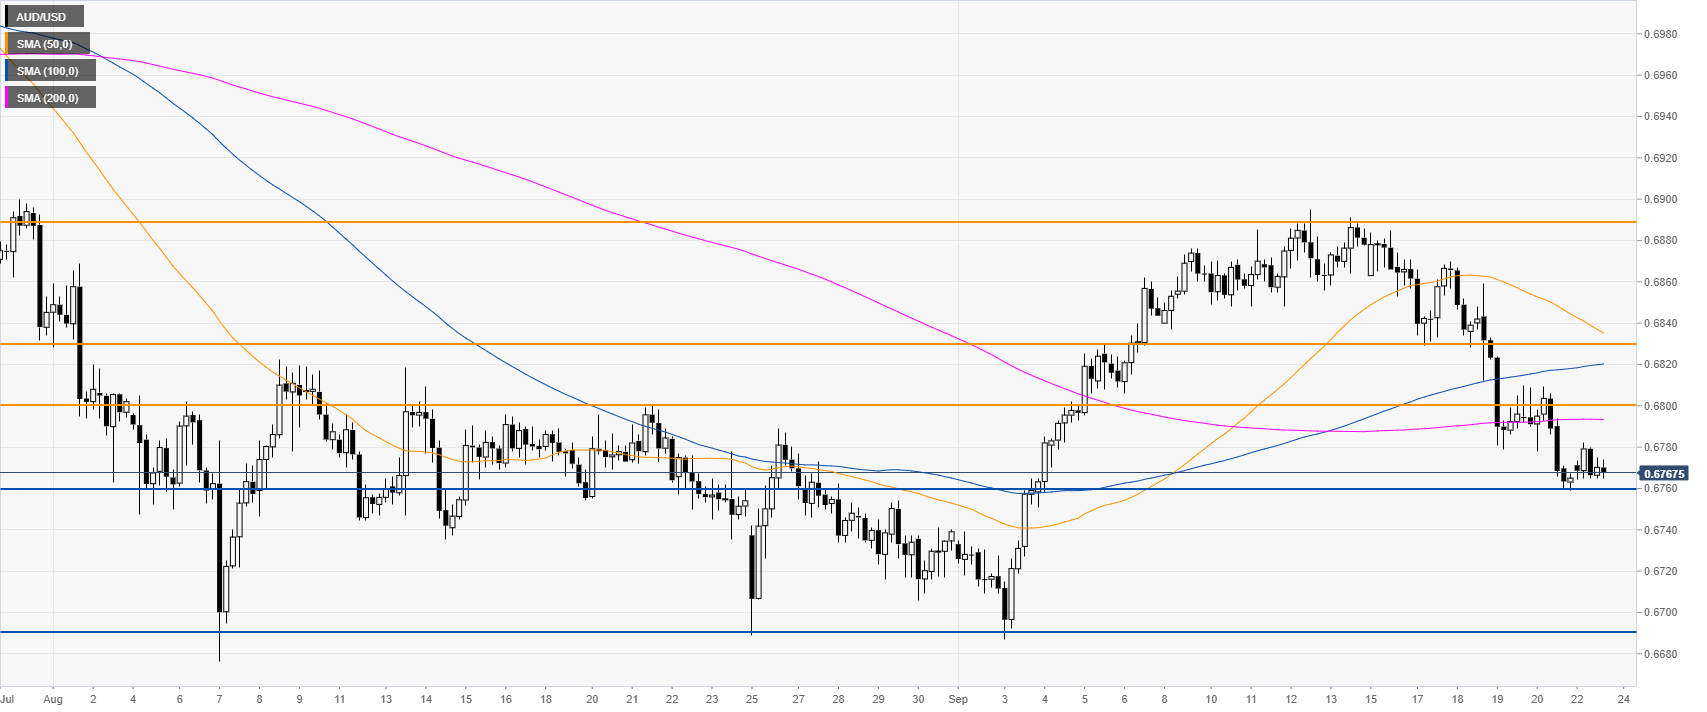
AUD/USD 4-hour chart

 
The Aussie is consolidating the recent losses below the 0.6800 handle and the 200 SMA. A break below the 0.6760 support level can lead to a drop to the 0.6690 swing low. 

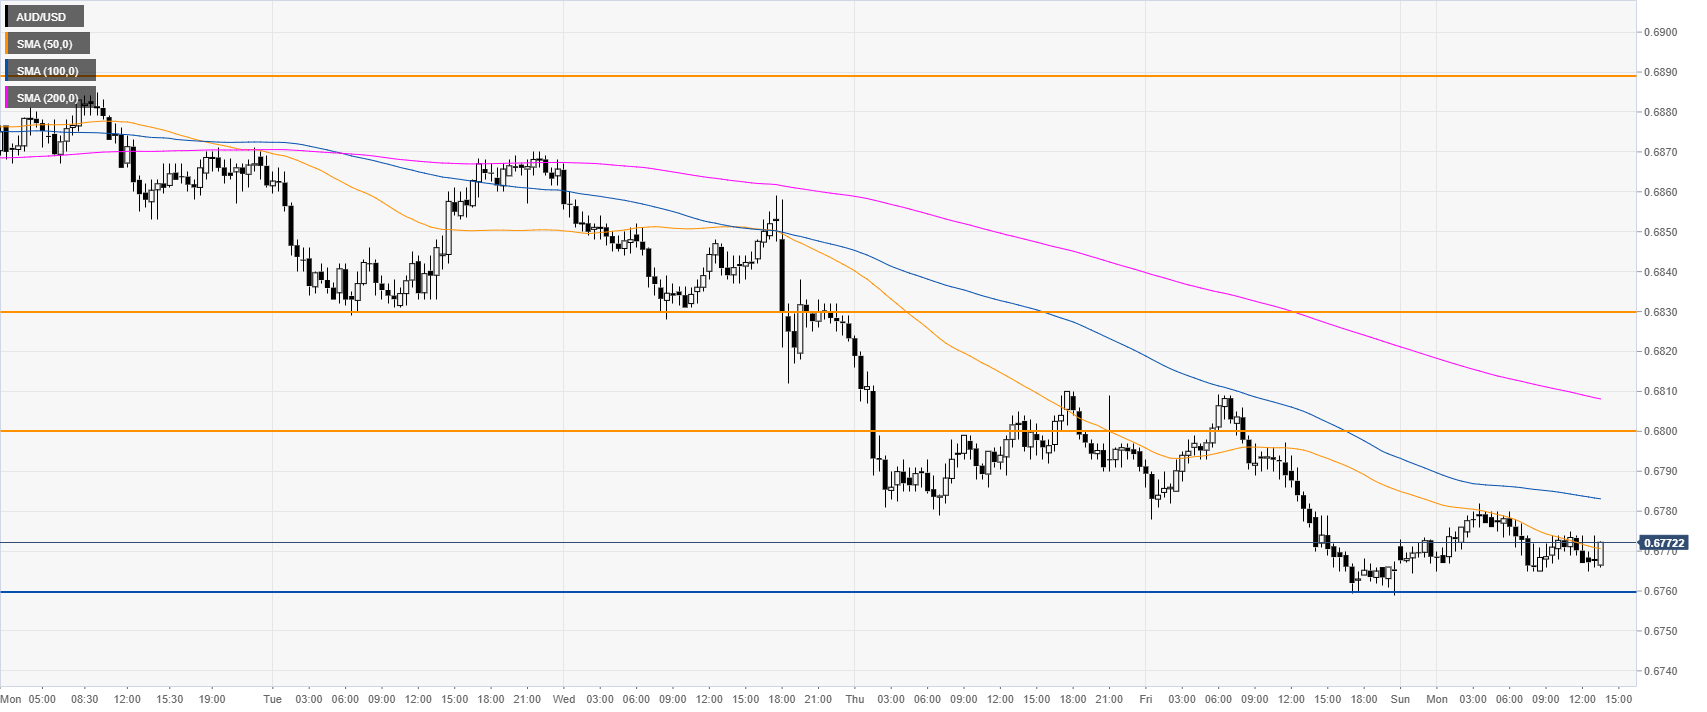
AUD/USD 30-minute chart

 
AUD/USD is under pressure below the main SMAs. Resistances are seen at the 0.6800 and 0.6830 price levels. 

Additional key levels

AUD/USD

Overview
Today last price0.6768
Today Daily Change0.0003
Today Daily Change %0.04
Today daily open0.6765
 
Trends
Daily SMA200.6805
Daily SMA500.6838
Daily SMA1000.6894
Daily SMA2000.7004
 
Levels
Previous Daily High0.6809
Previous Daily Low0.6759
Previous Weekly High0.6885
Previous Weekly Low0.6759
Previous Monthly High0.6869
Previous Monthly Low0.6676
Daily Fibonacci 38.2%0.6778
Daily Fibonacci 61.8%0.679
Daily Pivot Point S10.6746
Daily Pivot Point S20.6728
Daily Pivot Point S30.6696
Daily Pivot Point R10.6796
Daily Pivot Point R20.6828
Daily Pivot Point R30.6846

Author

Flavio Tosti

Flavio Tosti

Independent Analyst


More from Flavio Tosti
Share:

Editor's Picks

EUR/USD trims gains, hovers around 1.1900 post-US data

EUR/USD trades slightly on the back foot around the 1.1900 region in a context dominated by the resurgence of some buying interest around the US Dollar on turnaround Tuesday. Looking at the US docket, Retail Sales disappointed expectations in December, while the ADP 4-Week Average came in at 6.5K.

GBP/USD comes under pressure near 1.3680

The better tone in the Greenback hurts the risk-linked complex on Tuesday, prompting GBP/USD to set aside two consecutive days of gains and trade slightly on the defensive below the 1.3700 mark. Investors, in the meantime, keep their attention on key UK data due later in the week.

Gold loses some traction, still above $5,000

Gold faces some selling pressure on Tuesday, surrendering part of its recent two-day advance although managing to keep the trade above the $5,000 mark per troy ounce. The daily pullback in the precious metal comes in response to the modest rebound in the US Dollar, while declining US Treasury yields across the curve seem to limit the downside.

XRP holds $1.40 amid ETF inflows and stable derivatives market

Ripple trades under pressure, with immediate support at $1.40 holding at the time of writing on Tuesday. A recovery attempt from last week’s sell-off to $1.12 stalled at $1.54 on Friday, leading to limited price action between the current support and the resistance.

Dollar drops and stocks rally: The week of reckoning for US economic data

Following a sizeable move lower in US technology Stocks last week, we have witnessed a meaningful recovery unfold. The USD Index is in a concerning position; the monthly price continues to hold the south channel support.

XRP holds $1.40 amid ETF inflows and stable derivatives market

Ripple trades under pressure, with immediate support at $1.40 holding at the time of writing on Tuesday. A recovery attempt from last week’s sell-off to $1.12 stalled at $1.54 on Friday, leading to limited price action between the current support and the resistance.