AUD/USD stuck on the low end of near-term losses as Friday markets flatline
- AUD/USD cycles just north of 0.6550.
- Little Aussie data to chew on leaves AUD/USD in the lurch.
- Next week: double-header showings from RBA and Fed.

The AUD/USD is churning just above 0.6550 as markets prepare for next week’s double feature from the Reserve Bank of Australia (RBA) and the US Federal Reserve (Fed). Both central banks are broadly expected to hold interest rates steady as investors focus on when rate cuts will come. According to the CME’s FedWatch Tool, money markets were recently thrown a curve ball, and bets of a June rate cut from the Fed have eased to 60%, down from 70% at the start of the week.
Next week also brings Australia’s latest labor and employment figures on Thursday, and median market forecasts expect Australia’s Employment Change in February to add 30K new jobs, while the Unemployment Rate is forecast to tick down to 4.0% from 4.1%. Preliminary Judo Bank Australian Purchasing Managers Index (PMI) figures for February are also scheduled for early Thursday.
Broader markets will be focusing full-bore on next Wednesday’s Fed rate statement, where the US central bank is also expected to update the Fed Dot Plot summary of interest rate expectations. The near-term end of the Dot Plot curve is expected to tick up to 5.5% from the current 4.6%. With markets pinning hopes on at least three 25 basis point rate cuts from the Fed in 2024, investor sentiment has been at odds with the Fed’s own rate outlook for the entire year. The Fed projected three rate cuts through 2024, while money markets priced in an eye-watering six or seven rate cuts through the year totaling nearly 200 basis points in rate trims for the year.
As the US economy continues to churn at a healthy clip and inflation remains stubbornly sticky, markets have had little choice but to slash rate cut expectations, and rate futures traders are half-heartedly hoping for a June rate cut.
AUD/USD technical outlook
AUD/USD spent most of the trading week on the low side, backsliding into the 200-hour Simple Moving Average (SMA) near 0.6580 on Thursday. The 50-hour and 200-hour SMAs have begun a bearish crossover near 0.6585 as intraday price action tilts into the bearish side. The Aussie-Dollar pair flubbed a brief bullish push into the 0.6640 early in the week.
Friday’s third of a percent decline has the Aussie clattering into the 200-day SMA against the US Dollar near 0.6560, and momentum is tilted into bear country as the pair fails to find bullish momentum after a rebound from the last swing low into the 0.6450 handle.
AUD/USD hourly chart
AUD/USD daily chart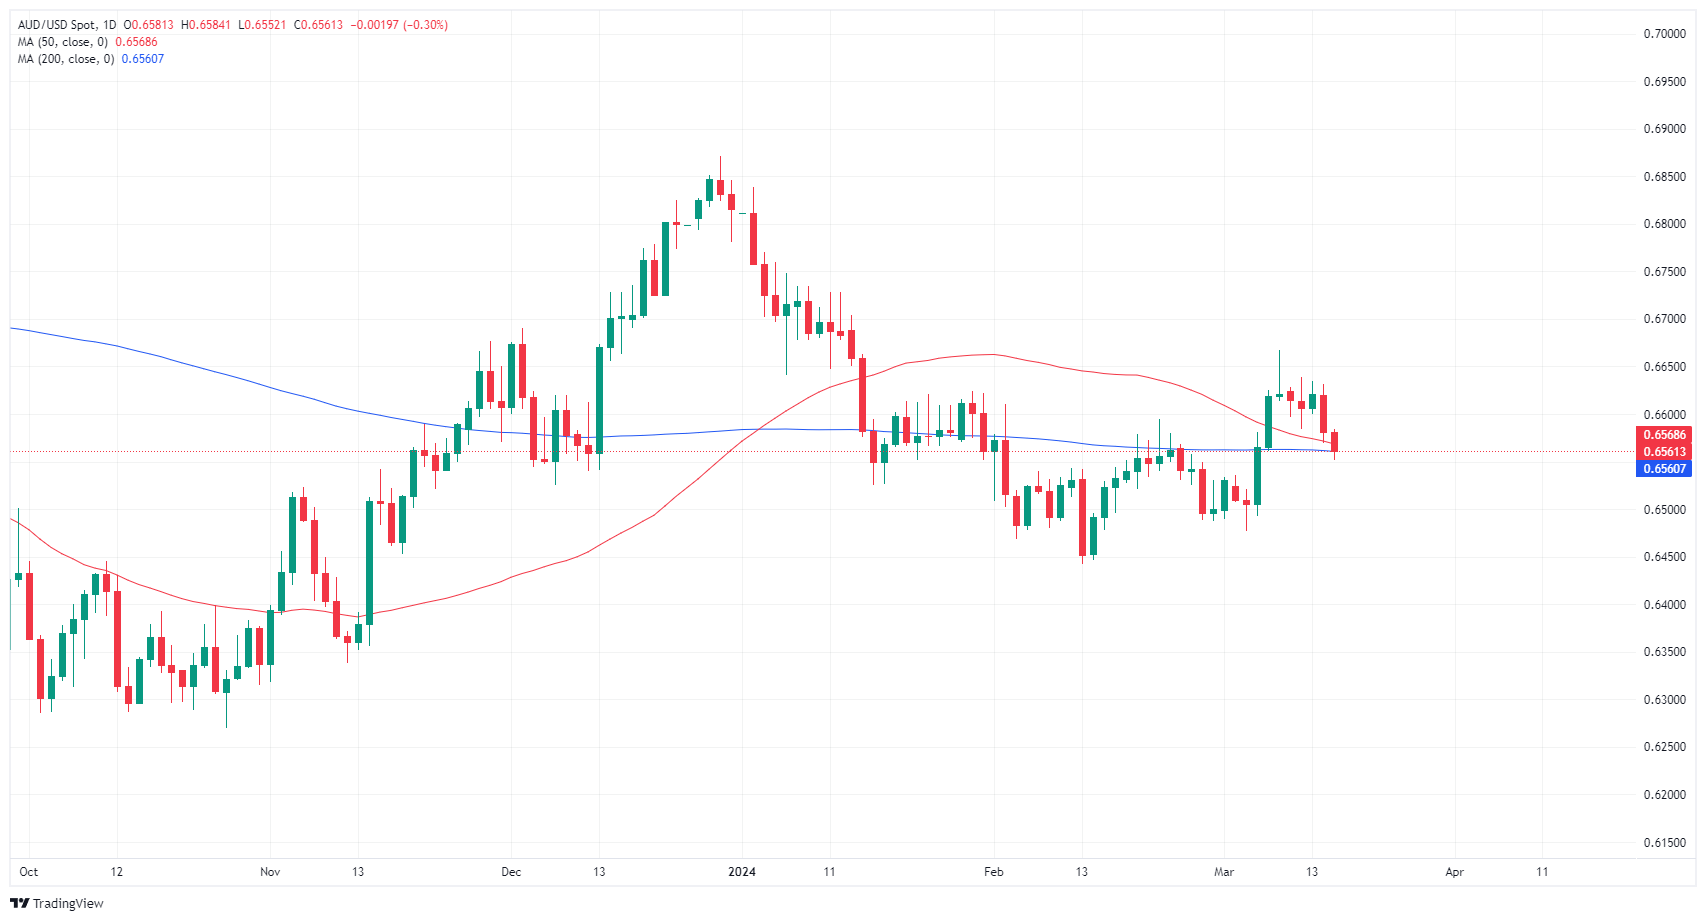
Author

Joshua Gibson
FXStreet
Joshua joins the FXStreet team as an Economics and Finance double major from Vancouver Island University with twelve years' experience as an independent trader focusing on technical analysis.