AUD/USD stalls at the 200-DMA and drops below 0.6800
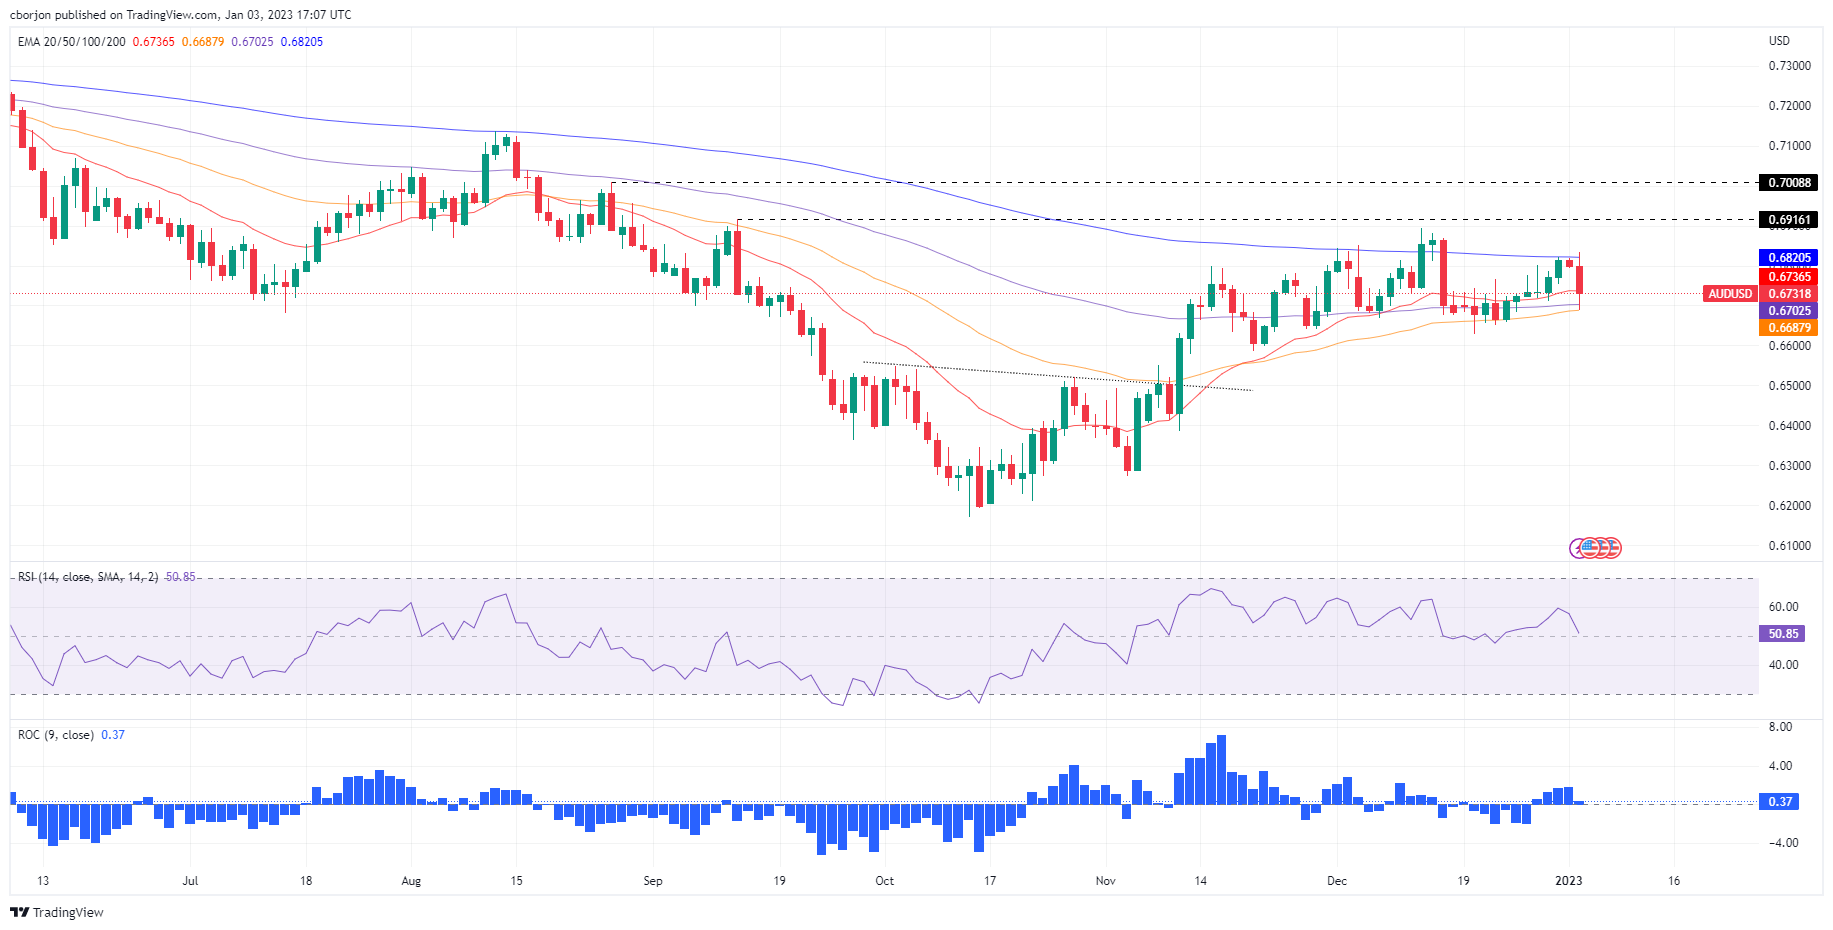
- AUD/USD drops below 0.6800 toward the 20-day EMA at 0.6736.
- The US Dollar remains bid, irrespective of falling US bond yields, after the release of weak PMIs.
- Weak Chinese economic data dampened the prospects of the Australian Dollar.
- AUD/USD Price Analysis: Likely to remain range-bound in the 0.66/0.68 200 pip range.

The Australian Dollar (AUD) plunges vs. the US Dollar (USD) as the AUD/USD pair fails to conquer the 200-day Exponential Moving Average (EMA), diving more than 60 pips or 0.99%, amidst a session driven by a strong US Dollar and negative sentiment. The AUD/USD is trading at 0.6728, below its opening price, after hitting a daily high of 0.6834.
AUD/USD tumbles due to a strong US Dollar
The beginning of 2023 has witnessed the US Dollar’s re-emergence, which is appreciating against most G8 currencies. The AUD/USD briefly pierced the 200-day EMA at 0.6820 but quickly reversed its earlier gains and dived as sentiment shifted sour, portrayed by Wall Street edging lower.
The first tranche of US economic data revealed that factory activity remained in contractionary territory, as the US S&P Global Manufacturing PMI for December’s final reading was unchanged at 46.2. Siân Jones, Senior Economist at S&P Global Market Intelligence, said, “The manufacturing sector posted a weak performance as 2022 was brought to a close, as output and new orders contracted at sharper rates. Demand for goods dwindled as domestic orders and export sales dropped. Muted demand conditions also led to downward adjustments of stock holdings.”
Elsewhere, the US Dollar Index (DXY), a gauge of the buck’s value vs. a basket of six currencies, edges up 1.12% at 104.653, hitting a new two-week high, hurting the prospects for higher AUD/USD prices.
On the Australian side, weak data revealed during the weekend on China slightly weighed on the Aussie Dollar (AUD). China’s Manufacturing PMI, announced by the National Bureau of Statistics (NBS), continued its downtrend to 47.0 vs. November’s 48. On the same side, the Caixin PMI declined to 49.0 in December, below the previous figures of 49.4.
Ahead into the week, the US economic docket remains busy with the release of the Federal Reserve’s (Fed) last meeting minutes, alongside the ISM Manufacturing PMI Index for December. Australia’s economic calendar will reveal the Reserve Bank of Australia’s (RBA) Chart pack.
AUD/USD Price Analysis: Technical outlook
From a daily chart perspective, the AUD/USD has continued to trade sideways since mid-November, trapped in a wide 0.6600/0.6800 range. It should be said that the AUD/USD inability to crack the 200-day Exponential Moving Average (EMA) suggests sellers are leaning toward it, which would pave the way for further losses. On the other hand, the bottom of the range, supported by the presence of the 20/50 and 100-day EMAs, would be difficult to surpass. So the AUD/USD might remain seesawing in the 0.66/0.68 200 pip range.
Author

Christian Borjon Valencia
FXStreet
Markets analyst, news editor, and trading instructor with over 14 years of experience across FX, commodities, US equity indices, and global macro markets.


