AUD/USD Price Analysis: Weekly close below 0.6200 would expose YTD lows
- AUD/USD finished the week with substantial losses of 2.61%.
- On Friday, the AUD/USD seesawed on a 200-pip range, notably reaching a weekly close below 0.6200.
- AUD/USD Price Forecast: To tumble to 0.6100 if sellers clear the YTD low; otherwise, a move towards 0.6300 is on the cards.

On Friday, the Australian dollar finished the week on the wrong foot, tumbling below 0.6200 amidst a dampened market mood, with investors dumping everything risk-perceived in the FX space, the Aussie dollar. Therefore, the AUD/USD accelerated its downfall, trading at 0.6199, below Friday’s opening price by 1.58%.
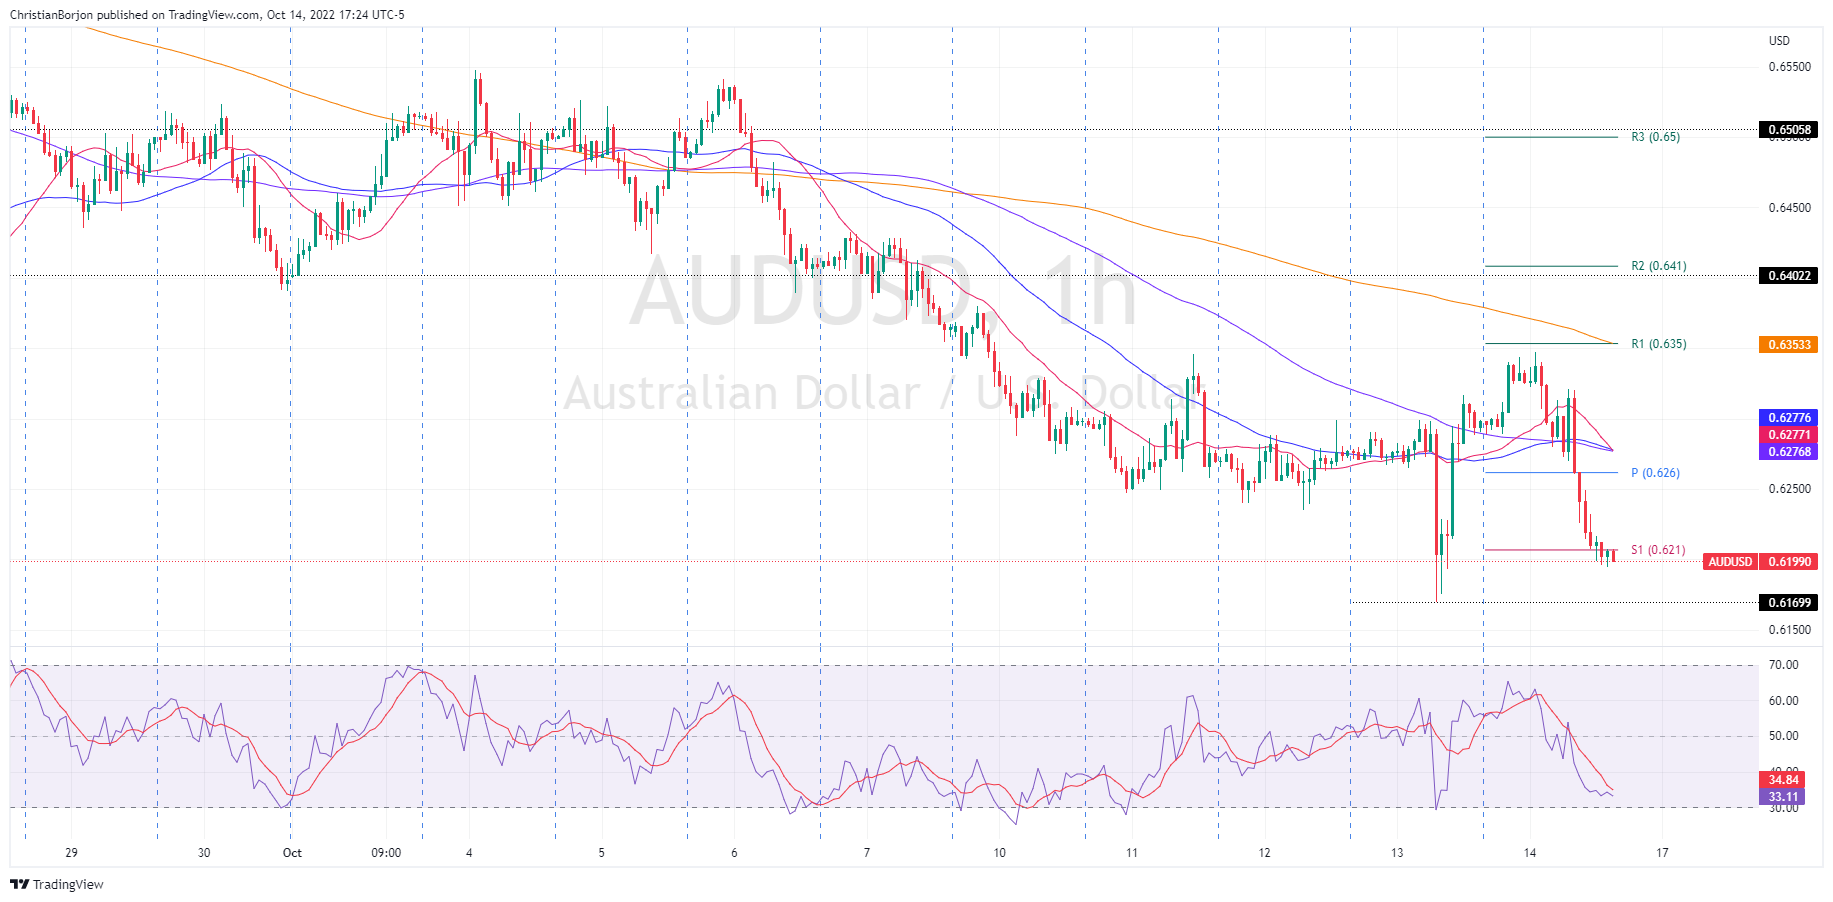
AUD/USD Price Forecast
The AUD/USD daily chart depicts the pair seesawed in a 220-pip range after hitting a daily high of 0.6347 before tumbling under the 0.6200 figure. Worth noting that on its way down, the AUD/USD Friday close was 0.6199, exposing crucial support levels, like the YTD low of 0.6169, which, if cleared, could open the door towards 0.6100.
Oscillators are at oversold conditions, though registering higher lows, while price action is registering lower lows. That said, a positive divergence might be forming.
In the short term, the AUD/USD is neutral biased, though oscillators in negative territory and price action could open the door for further downside action. Therefore, the AUD/USD first support would be the YTD low of 0.6169, followed by the 0.6100 figure. The break below will expose the figure at 0.6000.
Contrarily, if the AUD/JPY bounces from below 0.6200, it would expose essential resistance levels, like 0.6250, followed by the confluence of the 100, 20 and 50-EMAs, around 0.6276/77, followed by the 0.6300 mark.
AUD/USD Key Technical Levels
Author

Christian Borjon Valencia
FXStreet
Markets analyst, news editor, and trading instructor with over 14 years of experience across FX, commodities, US equity indices, and global macro markets.


