AUD/USD Price Analysis: Trading at the top of a range


  • AUD/USD has entered into a sideways range on the short-term charts. 
  • The pair has just formed a bearish candlestick at the range highs and is looking poised to weaken. 
  • A move back down is possible towards the range lows at 0.6420. 

AUD/USD is trading in the 0.6620s on Wednesday, ahead of key US data. The pair has entered a sideways trend on the 4-hour chart which is used to assess the direction of the short-term trend. 

AUD/USD 4-hour Chart


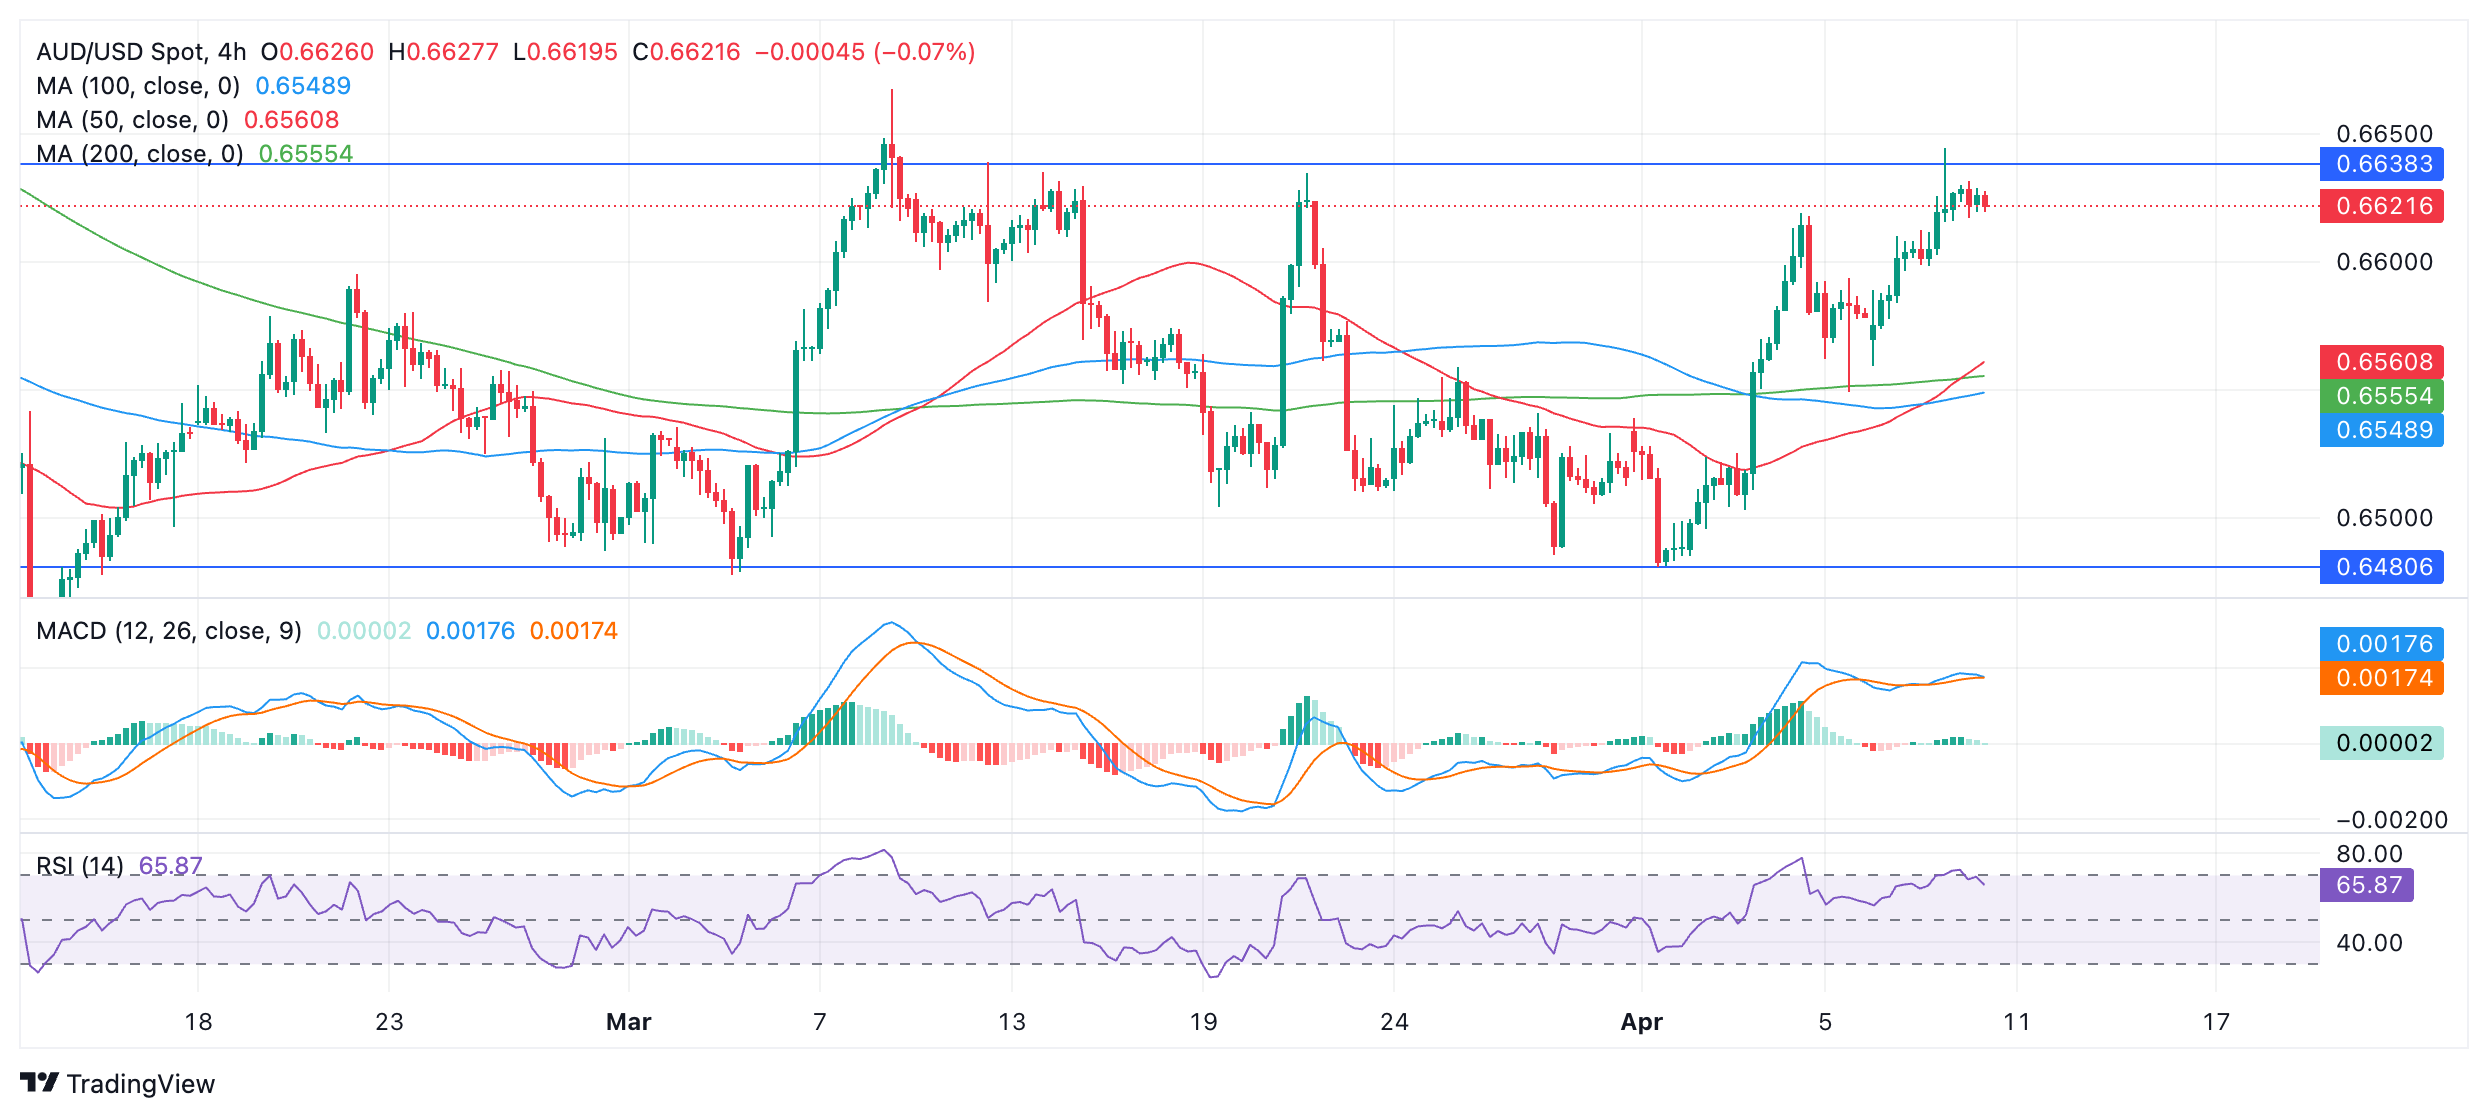
At the beginning of April price touched the bottom of the range low at 0.6480 and bounced. After that it started climbing back up to the top of the range. 

On Tuesday AUD/USD formed a bearish Shooting Star candlestick pattern at the top of the range in the 0.6640s. Although the following bar was green and therefore did not confirm the Shooting Star, it was nevertheless a negative sign. The pair has since been trading sideways in the 0.6620s. 

Given AUD/USD has been rejected at the range high and formed a bearish candlestick pattern at the same time, there is a risk of a reversal, and the price starting to move back down towards the range lows again, continuing the sideways trend. 

Both the Moving Average Convergence Divergence (MACD) and Relative Strength Index (RSI) momentum indicators are showing bearish divergence at the April 4 and April 9 peaks. Whereas price rose up and made a higher high between that period, both indicators failed to follow suit, indicating weakness. 

RSI has just exited the overbought region which is a further bearish sign. It recommends short-term bullish traders close their long bets and open short positions. 

A break below 0.6495 would help provide confirmatory evidence of a new move lower within the range, with a possible target back down at the 0.6420 range lows. 

The cluster of major Moving Averages are likely to provide support at around 0.6450, and could slow the pace of the sell-off.

A break above the April high at 0.6645 would negate the bearish view and could indicate a breakout, with an initial target at the 0.6668 March highs.


Share: Feed news

Information on these pages contains forward-looking statements that involve risks and uncertainties. Markets and instruments profiled on this page are for informational purposes only and should not in any way come across as a recommendation to buy or sell in these assets. You should do your own thorough research before making any investment decisions. FXStreet does not in any way guarantee that this information is free from mistakes, errors, or material misstatements. It also does not guarantee that this information is of a timely nature. Investing in Open Markets involves a great deal of risk, including the loss of all or a portion of your investment, as well as emotional distress. All risks, losses and costs associated with investing, including total loss of principal, are your responsibility. The views and opinions expressed in this article are those of the authors and do not necessarily reflect the official policy or position of FXStreet nor its advertisers. The author will not be held responsible for information that is found at the end of links posted on this page.

If not otherwise explicitly mentioned in the body of the article, at the time of writing, the author has no position in any stock mentioned in this article and no business relationship with any company mentioned. The author has not received compensation for writing this article, other than from FXStreet.

FXStreet and the author do not provide personalized recommendations. The author makes no representations as to the accuracy, completeness, or suitability of this information. FXStreet and the author will not be liable for any errors, omissions or any losses, injuries or damages arising from this information and its display or use. Errors and omissions excepted.

The author and FXStreet are not registered investment advisors and nothing in this article is intended to be investment advice.

Recommended content


Recommended content

Editors’ Picks

AUD/USD retargets the 0.6600 barrier and above

AUD/USD retargets the 0.6600 barrier and above

AUD/USD extended its positive streak for the sixth session in a row at the beginning of the week, managing to retest the transitory 100-day SMA near 0.6580 on the back of the solid performance of the commodity complex.

AUD/USD News

EUR/USD keeps the bullish bias above 1.0700

EUR/USD keeps the bullish bias above 1.0700

EUR/USD rapidly set aside Friday’s decline and regained strong upside traction in response to the marked retracement in the Greenback following the still-unconfirmed FX intervention by the Japanese MoF.

EUR/USD News

Gold advances for a third consecutive day

Gold advances for a third consecutive day

Gold fluctuates in a relatively tight channel above $2,330 on Monday. The benchmark 10-year US Treasury bond yield corrects lower and helps XAU/USD limit its losses ahead of this week's key Fed policy meeting.

Gold News

Bitcoin price dips to $62K range despite growing international BTC validation via spot ETFs

Bitcoin price dips to $62K range despite growing international BTC validation via spot ETFs

Bitcoin (BTC) price closed down for four weeks in a row, based on the weekly chart, and could be on track for another red candle this week. The last time it did this was in the middle of the bear market when it fell by 42% within a span of nine weeks. 

Read more

Japan intervention: Will it work?

Japan intervention: Will it work?

Dear Japan Intervenes in the Yen for the first time since November 2022 Will it work? Have we seen a top in USDJPY? Let's go through the charts.

Read more

Forex MAJORS

Cryptocurrencies

Signatures