- The Aussie climbs on the back of broad US dollar weakness.
- The market sentiment is mixed, as Asian equity futures seesaw between gainers and losers.
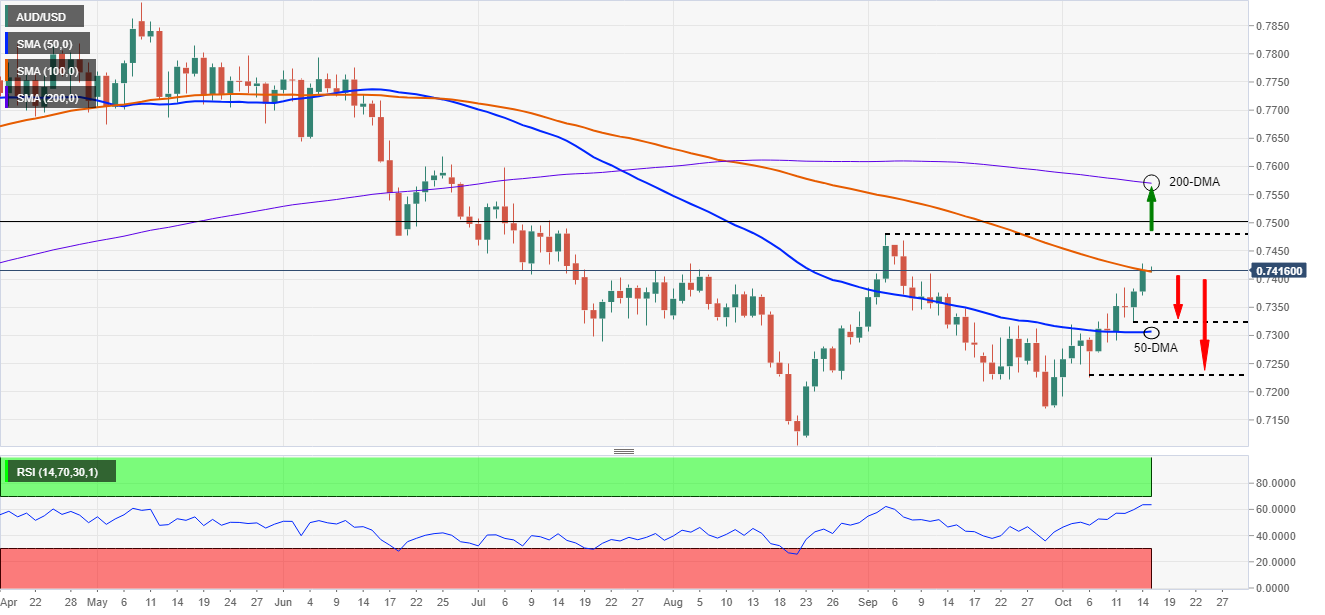
- AUD/USD: Downward pressured, as the 200-DMA remains above the spot price.
The AUD/USD begins the Asian session on the right foot, climbs 0.05%, trading at 0.7419, during the day at the time of writing.
The market sentiment was upbeat on Thursday, as portrayed by European and American stock indexes, finishing in the green. The US Dollar weakened across the board, slid 0.11% to end at 93.97, underpinned by falling US T-bond yields, with the 10-year benchmark note coupon, down three basis points, finished at 1.516%.
As the Asian session starts, the current mood, as witnessed by Asian equity futures, is split between gainers and losers. Meanwhile, the S&P/ASX Australian Stock Exchange and the Nikkei 225 are rising 0.60% and 1.46%, respectively.
AUD/USD Price Forecast: Technical outlook
Daily chart
The AUD/USD is trading below the 200-day moving average (DMA), indicating the pair is in a downtrend. The 50-DMA is well below the price action, whereas the 100-DMA at 0.7410, while underneath, is near the spot price. Momentum indicators like the Relative Strength Index (RSI) at 64 supports the upward trend, but a daily close above the 100-DMA could open the door for further gains.
In that outcome, the first resistance for the AUD/USD pair would be the September 3 high at 0.7477, immediately followed by 0.7500. A breach of that area would expose the 200-DMA at 0.7567.
On the other hand, failure at the 100-DMA would resume the downward trend, pressuring the pair towards the October 13 low at 0.7322. A clear break below the latter would expose key support levels, like the 50-DMA at 0.7304, followed by the October 6 low at 0.7225.
AUD/USD: KEY ADDITIONAL LEVELS TO WATCH
Information on these pages contains forward-looking statements that involve risks and uncertainties. Markets and instruments profiled on this page are for informational purposes only and should not in any way come across as a recommendation to buy or sell in these assets. You should do your own thorough research before making any investment decisions. FXStreet does not in any way guarantee that this information is free from mistakes, errors, or material misstatements. It also does not guarantee that this information is of a timely nature. Investing in Open Markets involves a great deal of risk, including the loss of all or a portion of your investment, as well as emotional distress. All risks, losses and costs associated with investing, including total loss of principal, are your responsibility. The views and opinions expressed in this article are those of the authors and do not necessarily reflect the official policy or position of FXStreet nor its advertisers. The author will not be held responsible for information that is found at the end of links posted on this page.
If not otherwise explicitly mentioned in the body of the article, at the time of writing, the author has no position in any stock mentioned in this article and no business relationship with any company mentioned. The author has not received compensation for writing this article, other than from FXStreet.
FXStreet and the author do not provide personalized recommendations. The author makes no representations as to the accuracy, completeness, or suitability of this information. FXStreet and the author will not be liable for any errors, omissions or any losses, injuries or damages arising from this information and its display or use. Errors and omissions excepted.
The author and FXStreet are not registered investment advisors and nothing in this article is intended to be investment advice.
Recommended content
Editors’ Picks
EUR/USD holds below 1.0750 ahead of key US data

EUR/USD trades in a tight range below 1.0750 in the European session on Friday. The US Dollar struggles to gather strength ahead of key PCE Price Index data, the Fed's preferred gauge of inflation, and helps the pair hold its ground.
GBP/USD consolidates above 1.2500, eyes on US PCE data

GBP/USD fluctuates at around 1.2500 in the European session on Friday following the three-day rebound. The PCE inflation data for March will be watched closely by market participants later in the day.
Gold clings to modest daily gains at around $2,350

Gold stays in positive territory at around $2,350 after closing in positive territory on Thursday. The benchmark 10-year US Treasury bond yield edges lower ahead of US PCE Price Index data, allowing XAU/USD to stretch higher.
Bitcoin Weekly Forecast: BTC’s next breakout could propel it to $80,000 Premium

Bitcoin’s recent price consolidation could be nearing its end as technical indicators and on-chain metrics suggest a potential upward breakout. However, this move would not be straightforward and could punish impatient investors.
US core PCE inflation set to signal firm price pressures as markets delay Federal Reserve rate cut bets

The core PCE Price Index, which excludes volatile food and energy prices, is seen as the more influential measure of inflation in terms of Fed positioning. The index is forecast to rise 0.3% on a monthly basis in March, matching February’s increase.