AUD/USD Price Analysis: Gathers momentum for a breakdown below 0.6400


  • Oscillation around 0.6400 indicates a build-up of shorts for a breakdown.
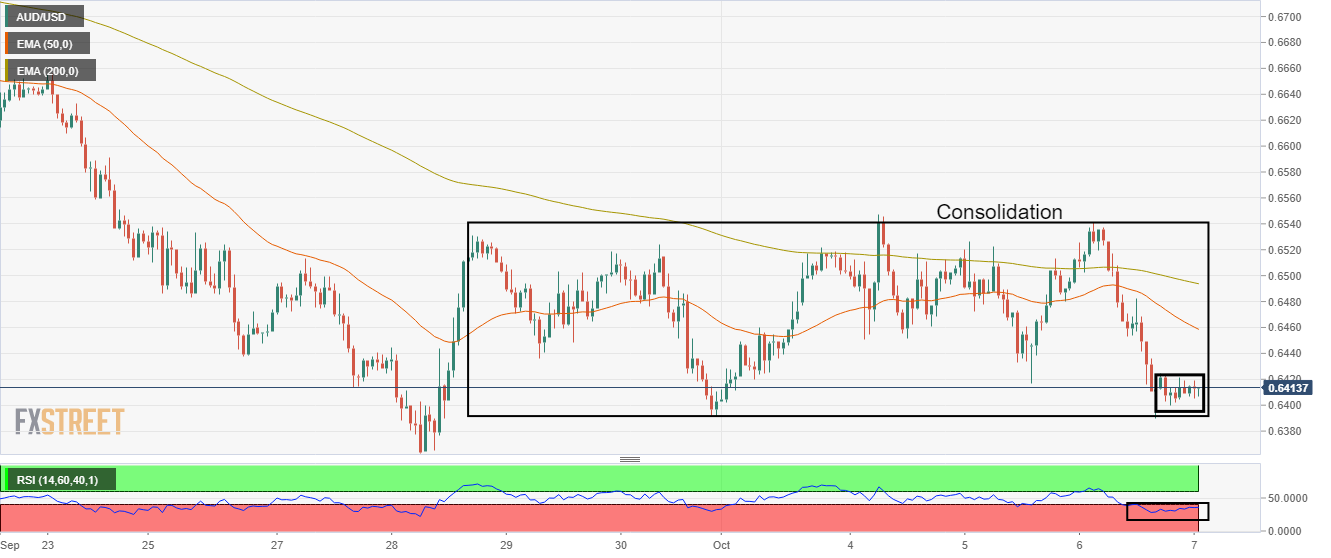
  • Declining 50-and 200-EMAs add to the downside filters.
  • The RSI (14) has shifted into the bearish range of 20.00-40.00.

The AUD/USD pair is displaying back-and-forth moves in a narrow range of 0.6400-0.6422 in the Tokyo session. The asset has turned sideways after a perpendicular fall from 0.6540 as the market sentiment turned extremely sour on geopolitical tensions and a downward revised outlook on growth prospects from the International Monetary Fund (IMF).

On an hourly scale, the asset has been auctioning in an inventory adjustment process chartered in a 0.6390-0.6548 range. As the major is still oscillating inside the defined territory, it is difficult to tag it as a breakout or a breakdown. It is worth noting that the asset is oscillating near the lower portion around 0.6400. The sideways auction is followed by a perpendicular fall, therefore, chances are the greenback bulls are gathering momentum for a downside break.

Meanwhile, the 50-and 200-period Exponential Moving Averages (EMAs) at 0.6494 and 0.6457 respectively have titled towards the south, which indicates weakness ahead.

Also, the Relative Strength Index (RSI) (14) has shifted into the bearish range of 20.00-40.00, which adds to the downside filters.

Going forward, a drop below the two-year low at 0.6363 will drag the asset towards the 16 April 2020 low at 0.6264, followed by the round-level support at 0.6100.

On the flip side, a break above Tuesday’s high at 0.6547 will drive the asset toward September 22 high at 0.6670 and September 18 high at 0.6734.

AUD/USD hourly chart

AUD/USD

Overview
Today last price 0.641
Today Daily Change 0.0010
Today Daily Change % 0.16
Today daily open 0.6405
 
Trends
Daily SMA20 0.6604
Daily SMA50 0.6794
Daily SMA100 0.6883
Daily SMA200 0.7061
 
Levels
Previous Daily High 0.6541
Previous Daily Low 0.639
Previous Weekly High 0.6538
Previous Weekly Low 0.6363
Previous Monthly High 0.6916
Previous Monthly Low 0.6363
Daily Fibonacci 38.2% 0.6447
Daily Fibonacci 61.8% 0.6483
Daily Pivot Point S1 0.635
Daily Pivot Point S2 0.6294
Daily Pivot Point S3 0.6198
Daily Pivot Point R1 0.6501
Daily Pivot Point R2 0.6597
Daily Pivot Point R3 0.6652


Share: Feed news

Information on these pages contains forward-looking statements that involve risks and uncertainties. Markets and instruments profiled on this page are for informational purposes only and should not in any way come across as a recommendation to buy or sell in these assets. You should do your own thorough research before making any investment decisions. FXStreet does not in any way guarantee that this information is free from mistakes, errors, or material misstatements. It also does not guarantee that this information is of a timely nature. Investing in Open Markets involves a great deal of risk, including the loss of all or a portion of your investment, as well as emotional distress. All risks, losses and costs associated with investing, including total loss of principal, are your responsibility. The views and opinions expressed in this article are those of the authors and do not necessarily reflect the official policy or position of FXStreet nor its advertisers. The author will not be held responsible for information that is found at the end of links posted on this page.

If not otherwise explicitly mentioned in the body of the article, at the time of writing, the author has no position in any stock mentioned in this article and no business relationship with any company mentioned. The author has not received compensation for writing this article, other than from FXStreet.

FXStreet and the author do not provide personalized recommendations. The author makes no representations as to the accuracy, completeness, or suitability of this information. FXStreet and the author will not be liable for any errors, omissions or any losses, injuries or damages arising from this information and its display or use. Errors and omissions excepted.

The author and FXStreet are not registered investment advisors and nothing in this article is intended to be investment advice.

Recommended content


Recommended content

Editors’ Picks

AUD/USD favours extra retracements in the short term

AUD/USD favours extra retracements in the short term

AUD/USD kept the negative stance well in place and briefly broke below the key 0.6400 support to clinch a new low for the year on the back of the strong dollar and mixed results from the Chinese docket.

AUD/USD News

EUR/USD now shifts its attention to 1.0500

EUR/USD now shifts its attention to 1.0500

The ongoing upward momentum of the Greenback prompted EUR/USD to lose more ground, hitting new lows for 2024 around 1.0600, driven by the significant divergence in monetary policy between the Fed and the ECB.

EUR/USD News

Gold ascends but remains shy of testing $2,400 amid hawkish Fed remarks

Gold ascends but remains shy of testing $2,400 amid hawkish Fed remarks

Gold prices edged higher late in North American session, gaining 0.22% following a hawkish tilt by Fed Chair Jerome Powell. Economic data from the United States was mixed, though Monday’s Retail Sales report and Powell’s remarks kept US Treasury yields higher, capping the yellow metal’s advance.

Gold News

Bitcoin price outlook amid increased demand and speculation pre-halving

Bitcoin price outlook amid increased demand and speculation pre-halving

Bitcoin price is edging lower as markets count only days to the halving. Nevertheless, the dump has not shaken the faith of large holders as they continue to cling to their holding even after a month of steady dumps.  

Read more

UK CPI inflation data ahead: Sterling hovering north of key support

UK CPI inflation data ahead: Sterling hovering north of key support

Following today's mixed bag of employment and wages data, today’s attention is directed to the March UK CPI inflation release. Both headline and core measures have surprised to the downside in the previous two releases and are expected to demonstrate further evidence of disinflation.

Read more

Forex MAJORS

Cryptocurrencies

Signatures