AUD/USD Price Analysis: Eyes 0.7760. as tide appears to turn in favor of bulls
- AUD/USD finds support once again near 0.7710, as DXY retreats.
- Hourly RSI pierces through the midline into the bullish zone.
- The aussie bulls look to test the 0.7750-0.7760 range.

AUD/USD is extending its rebound in European trading, having found strong support once again near the 0.7710 region.
The aussie draws support from a fresh decline in the US dollar vs. its main peers, tracking the weakness in the Treasury yields. Fading Fed’s tapering bets weigh on the US rates and the greenback.
Earlier in the Asian session, AUD/USD resumed Friday’s decline after China reiterated that it remains committed to fending off financial risks by putting a curb on rising commodities prices. Chinese iron-ore futures fell about 10% while Comex Copper dropped 0.60% on China’s concerns.
From a near-term technical perspective, the spot remains exposed to further upside risks, as it has recaptured the bearish 21-hourly moving average (HMA) at 0.7737 on its road to recovery from 0.7713 lows.
The horizontal 50-HMA at 0.7750 now remains in the buyers’ sight, above which the confluence of the 100 and 200-HMAs around 0.7760 could be challenged.
The Relative Strength Index (RSI) pierces through the central line to now trade firmer in the positive territory, suggesting that the tide has turned in favor of the aussie buyers.
AUD/USD hourly chart
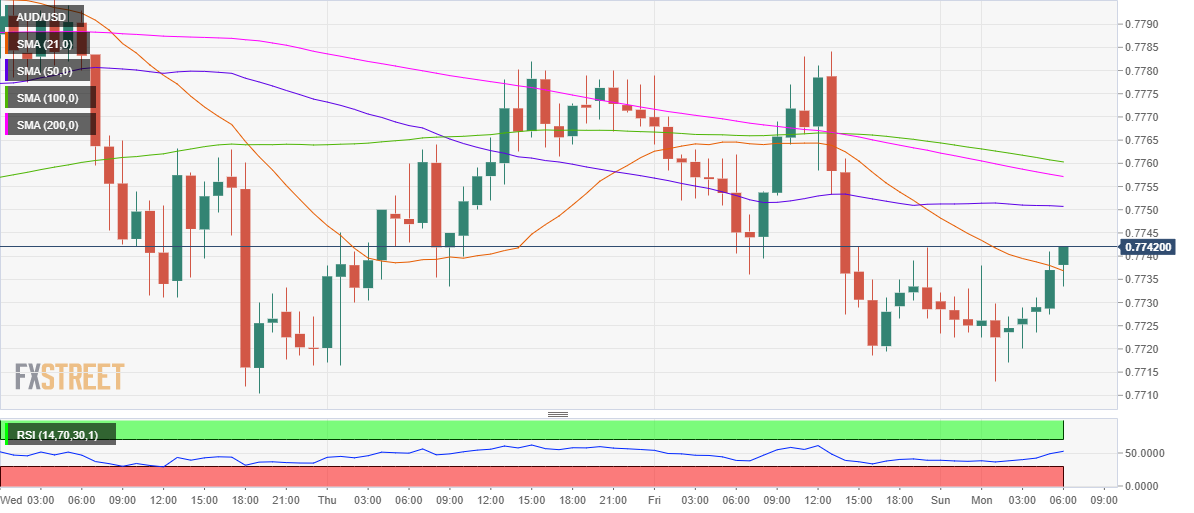
However, if the price fails to find acceptance above the 50-HMA, then a U-turn towards the 21-SMA resistance now support cannot be ruled.
Further south, the daily low could be retested ahead of the psychological $0.7700 barrier.
AUD/USD additional levels to watch
Author

Dhwani Mehta
FXStreet
Residing in Mumbai (India), Dhwani is a Senior Analyst and Manager of the Asian session at FXStreet. She has over 10 years of experience in analyzing and covering the global financial markets, with specialization in Forex and commodities markets.
















