AUD/USD Price Analysis: Bulls test bearish commitments near 21-DMA
- AUD/USD shoots to test the 0.73 area and the 61.8% Fibo.
- 21-day MA and prior support may hold up the progress near 0.7320.

AUD/USD has shot up to fill in the prior day's wick to a 61.8% Fibonacci retracement target and now faces a wall of resistance.
The following illustrates the market structure and a probable path for the pair in the coming days.
AUD/USD daily chart
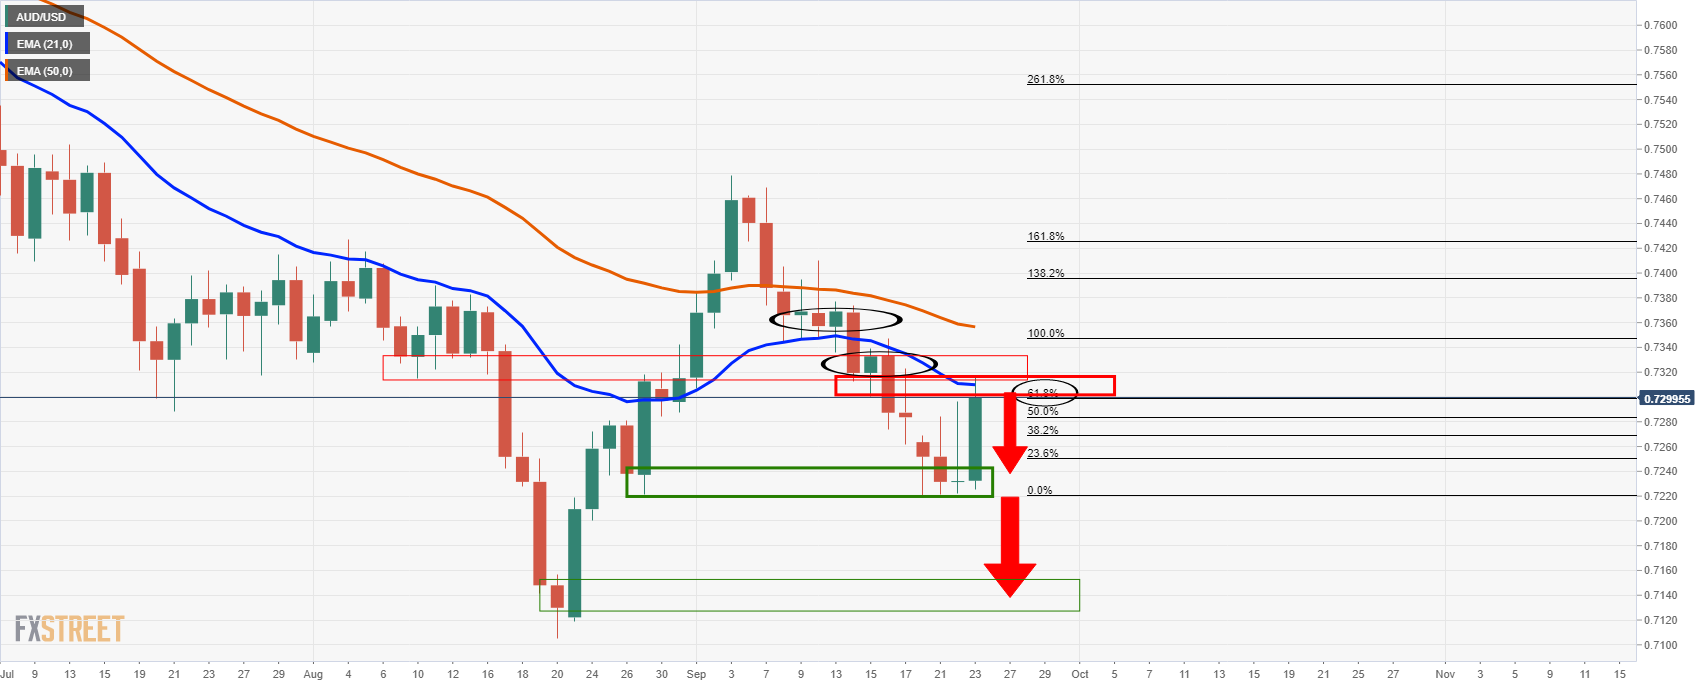
AUD/USD has rallied to test the 0.73 areas in a strong bullish impulse on Thursday. However, the 0.7320 resistance could be a tough nut to crack with it being reinforced by the 21-day moving average and the summer support looking left. Failures below the 21 or the 50-day moving averages would likely lead to a downside continuation for the coming days.
Author

Ross J Burland
FXStreet
Ross J Burland, born in England, UK, is a sportsman at heart. He played Rugby and Judo for his county, Kent and the South East of England Rugby team.


