AUD/USD Price Analysis: Bulls have the upper hand near 0.6430-35 area, over three-week high
- AUD/USD gains traction for the second straight day and climbs to over a three-week top.
- The post-FOMC USD selling bias turns out to be a key factor behind the ongoing move up.
- A move beyond the 50-day SMA and the 23.6% Fibo. supports prospects for further gains.

The AUD/USD pair builds on the previous day's strong move up and gains some follow-through positive traction for the second successive day on Thursday. The momentum is fueled by the post-FOMC US Dollar (USD) weakness and lifts spot prices to the 0.6435 area or a three-week top during the Asian session.
Despite the fact that the Federal Reserve (Fed) left the door open for additional rate hikes in the wake of the unexpected US economic resilience, investors seem convinced that the US central bank is nearing the end of its rate-hiking cycle. This is reinforced by the ongoing decline in the US Treasury bond yields, which, in turn, is seen weighing on the US Dollar (USD) and lending support to the AUD/USD pair.
Apart from this, a generally positive tone around the equity markets turns out to be another factor undermining the safe-haven Greenback and benefitting the risk-sensitive Australian Dollar (AUD). Bullish traders, meanwhile, seem unaffected by rather unimpressive Australian macro data, which showed that the trade surplus narrowed sharply from A$9.64 billion to A$6.786 billion in September and missed expectations.
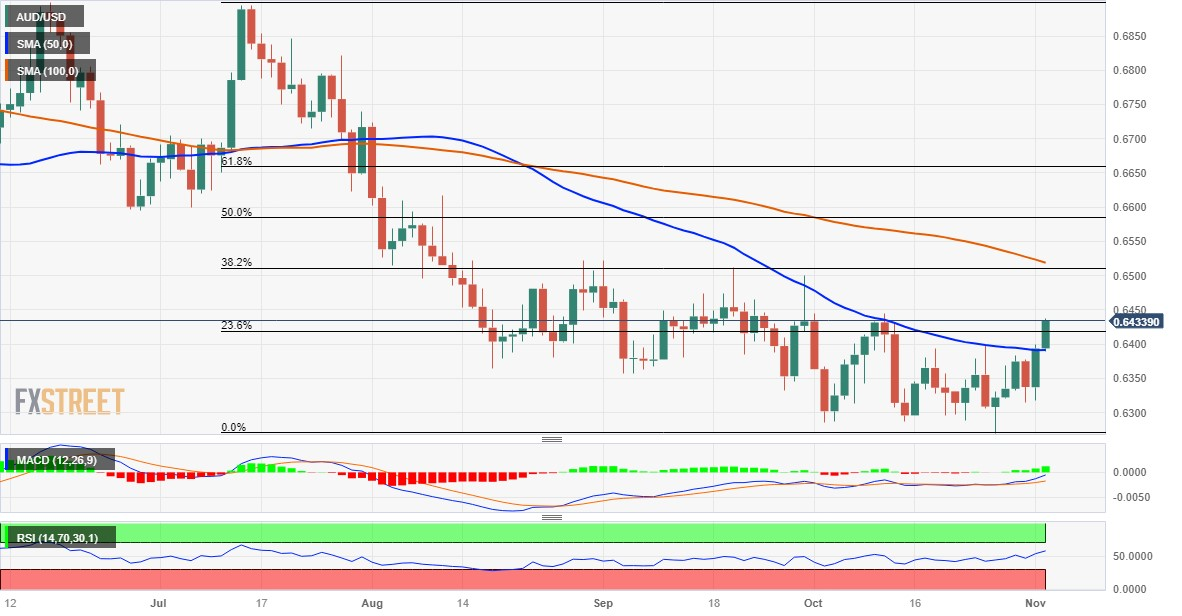
From a technical perspective, the AUD/USD pair has now found acceptance above the 50-day Simple Moving Average (SMA) for the first time since July. This, along with a move beyond the 23.6% Fibonacci retracement level of the July-October decline, could be seen as a fresh trigger for bullish traders. Moreover, oscillators on the daily chart have just started moving into positive territory and validate the constructive setup.
This, in turn, suggests that the path of least resistance for the AUD/USD pair is to the upside and supports prospects for a further appreciating move. Some follow-through buying beyond the October monthly swing high, around the 0.6445 region, will reaffirm the positive bias and allow spot prices to climb further towards the 0.6500-0.6510 confluence, comprising the 100-day SMA and the 38.2% Fibo. level.
On the flip side, the 50-day SMA resistance breakpoint – levels just below the 0.6400 mark – now seems to protect the immediate downside. A convincing break below will expose the 0.6335-0.6325 horizontal support, below which the AUD/USD pair could slide further towards the 0.6300 round-figure mark. Bears might then aim to challenge the YTD trough, around the 0.6270 region, touched on October 26.
AUD/USD daily chart
Technical levels to watch
Author

Haresh Menghani
FXStreet
Haresh Menghani is a detail-oriented professional with 10+ years of extensive experience in analysing the global financial markets.


