- AUD/USD gained strong positive traction on Tuesday amid a broad-based USD weakness.
- Slightly overbought conditions on hourly charts warrant some caution for bullish traders.
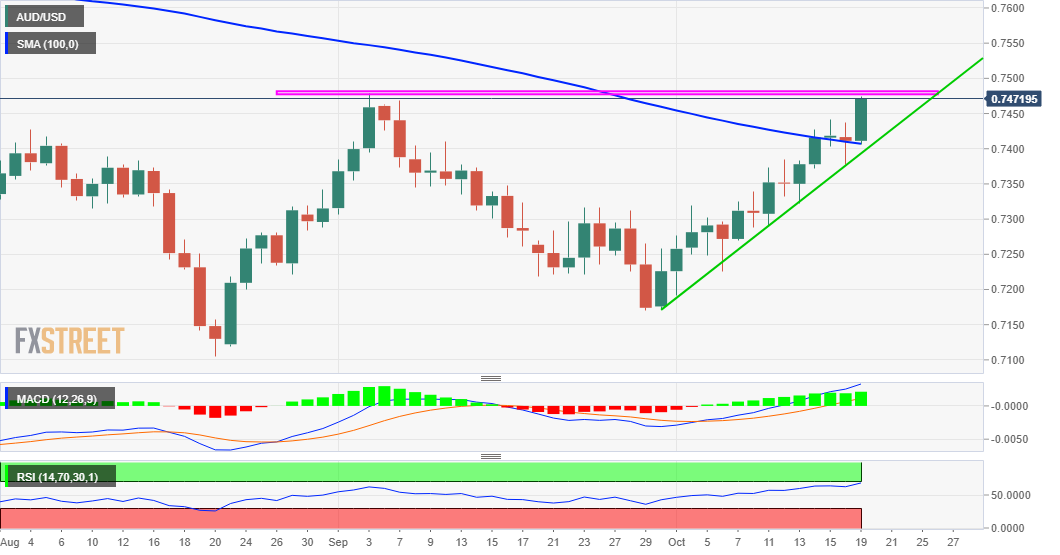
The USD selling bias picked up pace heading into the European session and pushed the AUD/USD pair back closer to September monthly swing highs, around the 0.7470-75 region in the last hour.
The resource-linked Australian dollar remained well supported by the recent widespread rally in commodity prices. This, along with the emergence of aggressive US dollar selling, assisted the AUD/USD pair to gain strong positive traction during the first half of the trading action on Tuesday.
The greenback was weighed down by the overnight pullback in the US Treasury bond yields and dismal US Industrial Production data, which fell by the most in seven months. Apart from this, a positive risk tone further undermined the safe-haven USD and benefitted the perceived riskier aussie.
Meanwhile, technical indicators on hourly charts are already flashing overbought conditions. Moreover, RSI (14) on the daily chart have moved on the verge of breaking about the 70 mark. This, in turn, warrants some caution for bulls and before positioning for any further appreciating move.
That said, some follow-through buying should pave the way for an extension of the recent strong positive move witnessed over the past four weeks or so. The momentum, however, could pause at higher levels and struggle to lift the AUD/USD pair further beyond the key 0.7500 psychological mark.
On the flip side, any meaningful pullback now seems to find decent support near the 0.7435 region. This is followed by the 0.7400 round-figure mark and the overnight swing lows, around the 0.7380-75 region, which should act as a strong near-term base for the AUD/USD pair.
The latter coincides with a short-term ascending trend-line support, which if broken will negate the positive bias and prompt some technical selling. The AUD/USD pair might then accelerate the fall towards the 0.7320-15 strong resistance breakpoint turned support en-route the 0.7300 mark.
AUD/USD daily chart
Technical levels to watch
Information on these pages contains forward-looking statements that involve risks and uncertainties. Markets and instruments profiled on this page are for informational purposes only and should not in any way come across as a recommendation to buy or sell in these assets. You should do your own thorough research before making any investment decisions. FXStreet does not in any way guarantee that this information is free from mistakes, errors, or material misstatements. It also does not guarantee that this information is of a timely nature. Investing in Open Markets involves a great deal of risk, including the loss of all or a portion of your investment, as well as emotional distress. All risks, losses and costs associated with investing, including total loss of principal, are your responsibility. The views and opinions expressed in this article are those of the authors and do not necessarily reflect the official policy or position of FXStreet nor its advertisers. The author will not be held responsible for information that is found at the end of links posted on this page.
If not otherwise explicitly mentioned in the body of the article, at the time of writing, the author has no position in any stock mentioned in this article and no business relationship with any company mentioned. The author has not received compensation for writing this article, other than from FXStreet.
FXStreet and the author do not provide personalized recommendations. The author makes no representations as to the accuracy, completeness, or suitability of this information. FXStreet and the author will not be liable for any errors, omissions or any losses, injuries or damages arising from this information and its display or use. Errors and omissions excepted.
The author and FXStreet are not registered investment advisors and nothing in this article is intended to be investment advice.
Recommended content
Editors’ Picks
EUR/USD holds above 1.0700 ahead of key US data

EUR/USD trades in a tight range above 1.0700 in the early European session on Friday. The US Dollar struggles to gather strength ahead of key PCE Price Index data, the Fed's preferred gauge of inflation, and helps the pair hold its ground.
USD/JPY stays above 156.00 after BoJ Governor Ueda's comments

USD/JPY holds above 156.00 after surging above this level with the initial reaction to the Bank of Japan's decision to leave the policy settings unchanged. BoJ Governor said weak Yen was not impacting prices but added that they will watch FX developments closely.
Gold price oscillates in a range as the focus remains glued to the US PCE Price Index

Gold price struggles to attract any meaningful buyers amid the emergence of fresh USD buying. Bets that the Fed will keep rates higher for longer amid sticky inflation help revive the USD demand.
Sei Price Prediction: SEI is in the zone of interest after a 10% leap

Sei price has been in recovery mode for almost ten days now, following a fall of almost 65% beginning in mid-March. While the SEI bulls continue to show strength, the uptrend could prove premature as massive bearish sentiment hovers above the altcoin’s price.
US core PCE inflation set to signal firm price pressures as markets delay Federal Reserve rate cut bets

The core PCE Price Index, which excludes volatile food and energy prices, is seen as the more influential measure of inflation in terms of Fed positioning. The index is forecast to rise 0.3% on a monthly basis in March, matching February’s increase.