|

AUD/USD Price Analysis: Bears appear well-set to approach 0.6540 support

  • AUD/USD remains depressed at the lowest levels in four months.
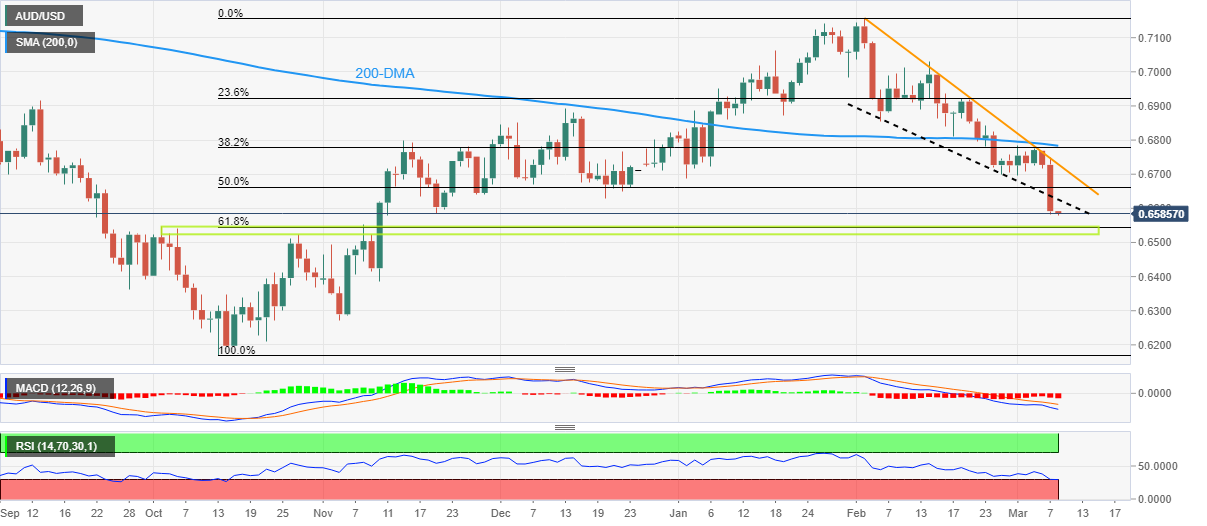
  • Clear downside break of previous support line from February, bearish MACD signals favor Aussie pair sellers.
  • 61.8% Fibonacci retracement level, five-month-old horizontal support zone join oversold RSI (14) to challenge bears.
  • AUD/USD recovery remains elusive below 0.6780-85 resistance confluence.

AUD/USD bears keep the reins at a four-month low, making rounds to 0.6580-90 during early Wednesday, following the biggest daily slump in a month.

That said, a clear downside break of a one-month-old descending trend line joins the bearish MACD signals to keep the Aussie sellers in the driver’s seat even if the latest inaction probes the downside momentum. On the same line could be the oversold conditions of the RSI (14) line.

Even so, the AUD/USD prices remain on their way to hitting the next key support area, namely the 0.6540-20 region comprising the 61.8% Fibonacci retracement level of October 2022 to February 2023 upside and multiple levels marked in the last five months.

It’s worth noting that the Aussie pair’s weakness past 0.6520 could aim for the last September’s low surrounding 0.6360 and may witness multiple supports near 0.6350-40 before highlighting the late 2022 bottom of around 0.6170.

Alternatively, the support-turned-resistance line from early February, close to 0.6630 by the press time, precedes the 50% Fibonacci retracement level of 0.6665 to cap the short-term upside of the AUD/USD pair.

Following that, a one-month-old descending resistance line near 0.6720 could lure the pair buyers.

However, a convergence of the 200-DMA and 38.2% Fibonacci retracement, near 0.6780-85, appears a tough nut to crack for the AUD/USD bulls.

AUD/USD: Daily chart

Trend: Limited downside expected

Additional important levels

Overview
Today last price0.6587
Today Daily Change-0.0005
Today Daily Change %-0.08%
Today daily open0.6592
 
Trends
Daily SMA200.6828
Daily SMA500.6896
Daily SMA1000.6757
Daily SMA2000.6787
 
Levels
Previous Daily High0.6748
Previous Daily Low0.6581
Previous Weekly High0.6784
Previous Weekly Low0.6695
Previous Monthly High0.7158
Previous Monthly Low0.6698
Daily Fibonacci 38.2%0.6645
Daily Fibonacci 61.8%0.6684
Daily Pivot Point S10.6533
Daily Pivot Point S20.6474
Daily Pivot Point S30.6366
Daily Pivot Point R10.6699
Daily Pivot Point R20.6807
Daily Pivot Point R30.6866

Author

Anil Panchal

Anil Panchal

FXStreet

Anil Panchal has nearly 15 years of experience in tracking financial markets. With a keen interest in macroeconomics, Anil aptly tracks global news/updates and stays well-informed about the global financial moves and their implications.

More from Anil Panchal
Share:

Editor's Picks

GBP/USD appears well offered near 1.3160

GBP/USD builds on Tuesday’s losses, although it now manages to pick up some pace and bounce off earlier multi-month troughs near 1.3140. The Greenback’s solid performance and continued political turmoil in the UK are keeping Cable under persistent pressure, with little sign of a meaningful recovery.

EUR/USD trims losses, hovers around 1.1350

EUR/USD now regains some composure and rebounds to the 1.1350 zone on Wednesday, partially reversing the prior pullback to fresh yearly lows near 1.1320. Meanwhile, spot remains on the back foot as the US Dollar continues to draw support from hawkish Fed expectations and uncertainty over the outcome of US-Iran peace negotiations.

Gold pressured near fresh 2026 lows

Gold accelerates its decline and gyrates around the key $4,000 mark per troy ounce on Wednesday, its lowest level since November 2025. In the meantime, tighter-for-longer Fed expectations and a broadly firmer US Dollar continue to weigh on the yellow metal, while uncertainty surrounding a potential US-Iran peace agreement has done little to revive demand for the safe haven space.

Crypto Today: Bitcoin, Ethereum, XRP trade under pressure as September Fed rate-hike odds increase

Bitcoin is trading between $62,000 and $63,000 at the time of writing on Wednesday, weighed down by headwinds stemming from macroeconomic uncertainty and geopolitical tensions in the Middle East.

5.90% to 5.45%: Why the Pound ignored the bond market’s relief rally

Keir Starmer resigned on Monday, and the Pound barely moved. That near-silence is the tell. Sterling's real driver these past four months has not been the prime minister, nor the left-leaning frontrunner lining up to replace him, but the long end of the gilt curve, which answers to a force no British politician controls.

Regime change: Inside Kevin Warsh's first move to make the Fed unreadable on purpose

The rate did not move. That was the least interesting thing about Kevin Warsh's first meeting in charge of the Fed. The FOMC held its benchmark at 3.50%-3.75% for the fourth straight meeting, exactly as priced, and then the new chair used his first press conference to dismantle the machinery the market has leaned on for a decade.