AUD/USD dips toward 0.6700, pressured by strong US data
- AUD/USD's continued decline fueled by robust US ADP employment and lower unemployment claims, overshadowing China's PMI data.
- Swaps market adjusts expectations for Federal Reserve policy, anticipating less aggressive rate cuts by end of 2024.
- Focus shifts to upcoming US Nonfarm Payrolls, with predictions of a decrease in job creation and a slight rise in unemployment rate.

The AUD/USD extends its losses in early trading on Thursday during the North American session, down 0.33% and at the brisk of diving below the 0.6700 figure. Solid economic data from the United States is the main reason behind the pair’s fall, while the Greenback (USD) recouped losses and rose, as shown by the US Dollar Index (DXY). The AUD/USD is trading at 0.6711 after hitting a daily high of 0.6759.
AUD/USD extends its losses to five straight days, as US jobs data improved
US jobs data revealed before Wall Street opened was solid, suggesting that inflationary pressures remain skewed to the upside. A report by Automatic Data Processing (ADP) and the University of Stanford revealed that companies hired more than expected, creating new 164K jobs, smashing economists' forecasts of 115. In additional data, the US Department of Labor (DoL) announced that unemployment claims for the week ending December 30 rose by 202K, less than estimates of 216K, and trailed by the prior reading of 220K.
After the data, the swaps market, priced in a less dovish Federal Reserve, with traders expecting 140 basis points of rate cuts toward the end of 2024, 30 basis points less than December’s 27 170 bps of cuts projected by investors, according to Chicago Board of Trade (CBOT) data.
Today’s data and yesterday's release of the latest Federal Reserve meeting minutes shifted traders' belief that the US central bank might begin easing policy sooner rather than later. The tone of the minutes was of uncertainty amongst policymakers in regard to the rate path to follow due to inflation risks remaining tilted to the upside.
Aside from this, the economic docket in Australia was absent, though China’s data influence the Aussie (AUD). In the Asian session, the Caixin PMI Services PMI improved to 52.9, above 51.5 in November, and beat the consensus of 51.5.
Ahead of the week, the Australian economic docket would be absent. On the US front, December’s Nonfarm Payrolls are expected to dip to 170K, below November’s 199K, and the Unemployment Rate Is estimated to uptick to 3.8% from 3.7%.
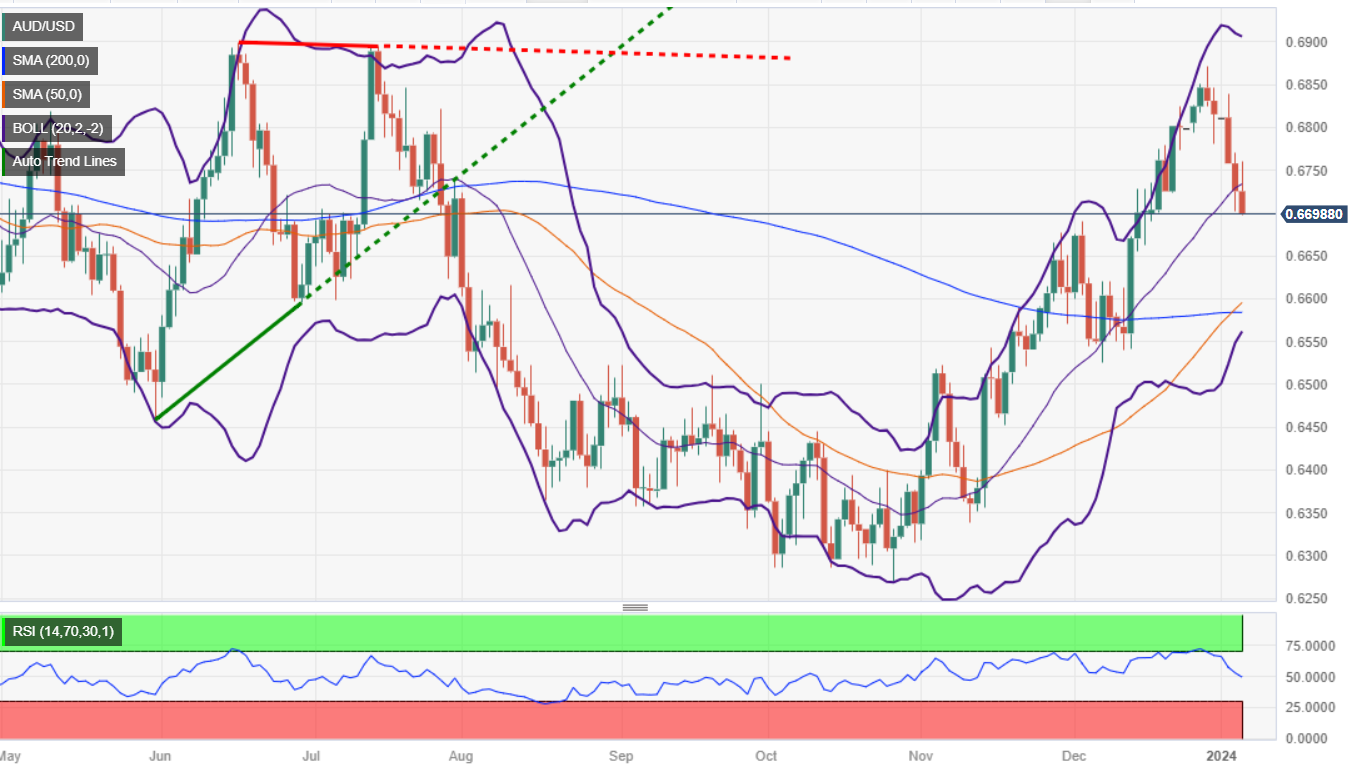
AUD/USD Price Analysis: Technical outlook
The daily chart depicts the pair under heavy downward pressure but remains above the current week’s low of 0.6701. A decisive break would exacerbate the AUD/USD’s fall toward the confluence of the 50 and 200-day moving averages (DMAs) at around 0.6582/84. Once surpassed, the next demand area would be a previous resistance-turned-support level at 0.6522, the November 6 high. On the other hand, if buyers keep the exchange rate above 0.6700 and reclaim the day's high at 0.6759, that could pave the way to test December’s 28 high of 0.6871.
Author

Christian Borjon Valencia
FXStreet
Markets analyst, news editor, and trading instructor with over 14 years of experience across FX, commodities, US equity indices, and global macro markets.


