|

AUD/USD bounces-back towards 21-HMA amid an uptick in S&P 500 futures

  • The aussie finds respite from a rebound in the S&P 500 futures.
  • Falling Treasury yields lift the market mood, cap the gains in the DXY.
  • 21-HMA offers immediate resistance while sellers remain hopefully.

AUD/USD is attempting a bounce above 0.7550 in the European session, having reached the lowest levels in four months at 0.7531 earlier on.

The recovery in the aussie could be attributed to the improved market mood amid strong Euro area Manufacturing PMI reports and falling Treasury yields. This is reflective of the 0.38% uptick in the S&P 500 futures.  

The negative sentiment around the US rates makes the aussie dollar more attractive as an alternative higher-yielding asset. The renewed buying interest in oil and gold prices also offer support to the commodities-linked aussie.

Markets now await the US ISM Manufacturing release for fresh trading impetus, as the unexpected drop in the Chinese Caixin Manufacturing PMI could likely remain a drag on the AUD.

AUD/USD: Technical Outlook

From a near-term technical perspective, the spot is looking to recapture the bearish 21-hourly moving average (HMA) at 0.7585 on the road to recovery.

The Relative Strength Index (RSI) has also rebounded from lows and points higher, as of writing, suggesting that there remains scope for additional recovery.

The next stop for the aussie bulls is seen at the 50-HMA of 0.7598, above which the 100-HMA at 0.7616 could be challenged.

AUD/USD: One-hour chart

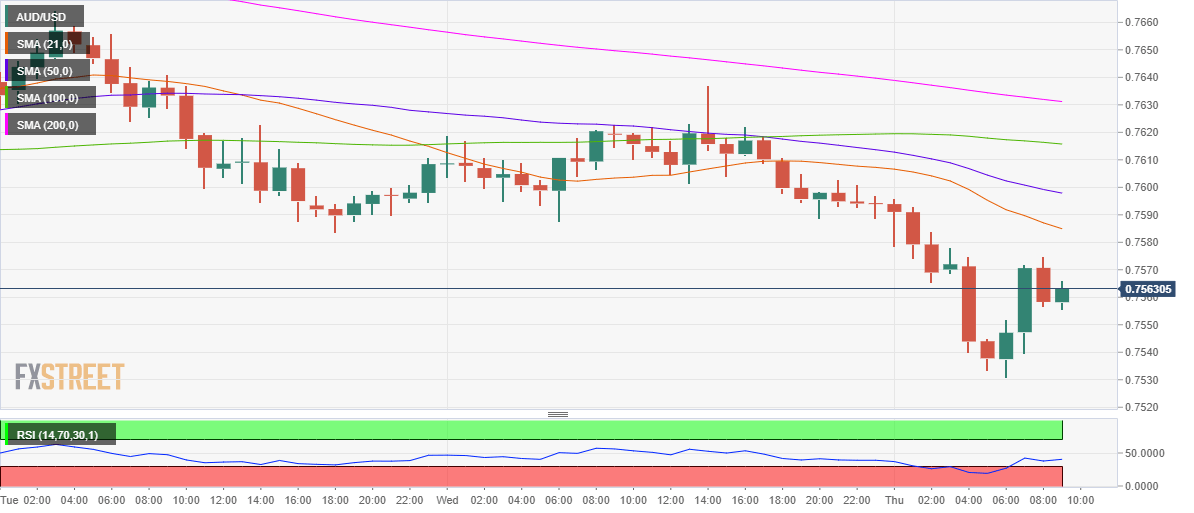
Meanwhile, should the spot face rejection at the 21-HMA then a drop back towards the multi-month lows cannot be ruled.

Further south, the 0.7500 threshold could come to the buyers’ rescue.

AUD/USD: Additional levels

AUD/USD

Overview
Today last price0.7566
Today Daily Change-0.0032
Today Daily Change %-0.42
Today daily open0.7598
 
Trends
Daily SMA200.7693
Daily SMA500.7725
Daily SMA1000.763
Daily SMA2000.7385
 
Levels
Previous Daily High0.7637
Previous Daily Low0.7588
Previous Weekly High0.7758
Previous Weekly Low0.7562
Previous Monthly High0.785
Previous Monthly Low0.7562
Daily Fibonacci 38.2%0.7618
Daily Fibonacci 61.8%0.7606
Daily Pivot Point S10.7578
Daily Pivot Point S20.7558
Daily Pivot Point S30.7529
Daily Pivot Point R10.7628
Daily Pivot Point R20.7657
Daily Pivot Point R30.7677

Author

Dhwani Mehta

Dhwani Mehta

FXStreet

Residing in Mumbai (India), Dhwani is a Senior Analyst and Manager of the Asian session at FXStreet. She has over 10 years of experience in analyzing and covering the global financial markets, with specialization in Forex and commodities markets.

More from Dhwani Mehta
Share:

Editor's Picks

AUD/USD eyes 0.7150 barrier nine-day EMA

AUD/USD inches higher after registering modest losses in the previous day, trading around 0.7130 during the Asian hours. The technical analysis of the daily chart indicates that the pair is moving sideways within the rectangle pattern, suggesting a consolidation as neither the bulls nor the bears have enough momentum to take control of the market.

USD/JPY trades below 160.00 intervention threshold; bullish bias intact

The USD/JPY pair attracts some sellers during the Asian session amid fears that authorities will step in again to prop up the Japanese Yen. Furthermore, the Israel-Lebanon truce prompts some profit-taking around the US Dollar and exerts downward pressure on the currency pair.

Gold defends 200-day SMA at $4,425, but for how long?

Gold is attempting a tepid recovery toward $4,500 early Thursday, as renewed optimism in the Mideast geopolitical front calms market nerves. This cautious optimism across Asian markets weighs on Oil prices, and diminishes the US Dollar’s safe-haven appeal, helping Gold stage a decent comeback from the weekly low of $4,424.


Hyperliquid: ETF demand, capital rotation fuel HYPE rally as Bitcoin melts

Hyperliquid price sustains an upward trend near its all-time high of $75.76 on Thursday after posting 80% gains in May, while Bitcoin (BTC) retraces below $65,000, triggering a market-wide panic.

Kevin Warsh takes the Fed helm: What it means for the US Dollar
The Federal Reserve moves away from the highly predictable "forward guidance" model of the Jerome Powell era to a new “Kevin Warsh environment”, characterized by less communication, more policy surprises, and an increased focus on the Fed's complex balance sheet.
Recession on paper: What really moves the Canadian Loonie now?

Statistics Canada handed the headline writers a gift and the analysts a headache. Real GDP shrank 0.1% on an annualized basis in the first quarter, and with the fourth quarter of 2025 revised down to a 1.0% contraction, that is two negative quarters in a row, the textbook definition of a technical recession and Canada's first since the pandemic.