|

AUD/NZD technical analysis: Sellers struggle around horizontal support despite Kiwi positive data

  • Buyers keep lurking around recent lows despite Kiwi positive GDP numbers.
  • An uptick beyond 100-DMA can trigger short-covering moves.
  • 61.8% Fibo. appears next on sellers’ radar past-1.0495.

Even if New Zealand GDP data came in better than expected, the AUD/NZD pair refrains from declining below short-term horizontal-support as it takes the rounds to 1.0497 amid early Thursday’s trading.

New Zealand’s Q1 2019 GDP crossed 2.4% forecast to clock in 2.5% upwardly revised prior while remaining unchanged and meeting wide expectations with 0.6% QoQ figure.

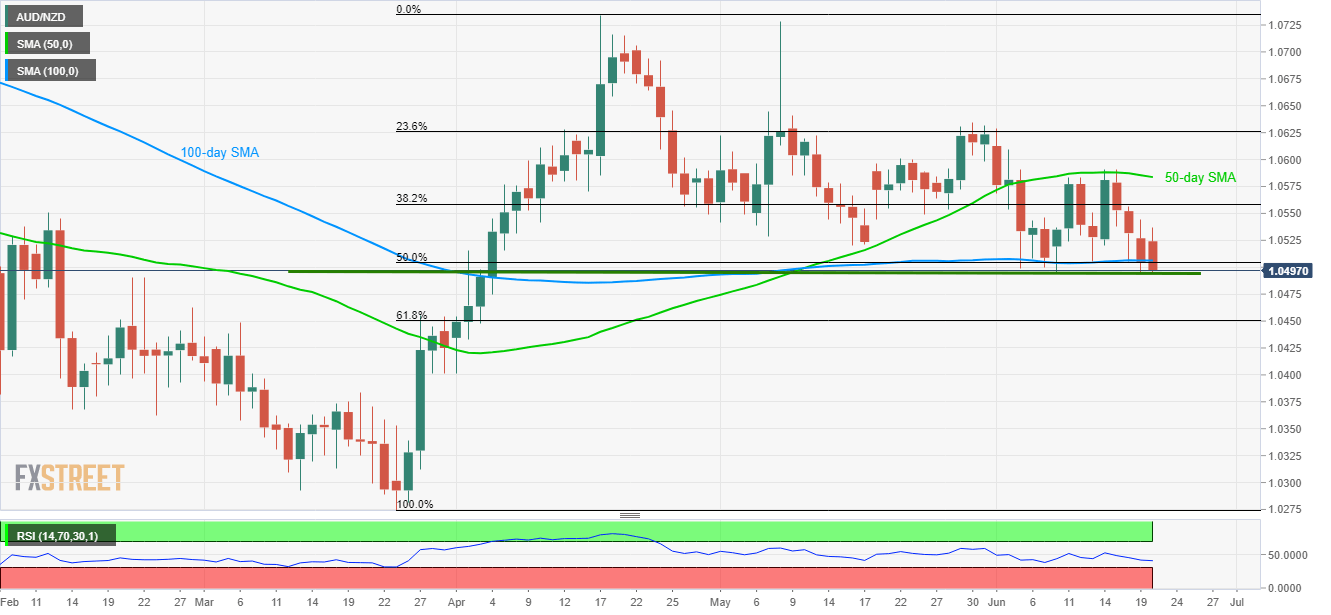
The 1.0500 – 1.0495 support-zone comprising current month low and high of April 03 challenges the pair’s recent downturn, a break of which opens the door for additional declines to 61.8% Fibonacci retracement of March – April upside, at 1.0450.

During the quote’s extended south-run under 1.0450, late-March lows surrounding 1.0400 and 1.0275 could become bears’ favorites.

On the upside, a pullback beyond 100-day simple moving average (SMA) level of 1.0507 can trigger fresh short-covering moves towards 1.0540 and 38.2% Fibonacci retracement near 1.0560.

However, pair’s further increase above 1.0560 will be challenged by 50-day SMA level of 1.0585, if not then bulls can aim for 1.0600 and May-end tops near 1.0635.

AUD/NZD daily chart

Trend: Pullback expected

Additional important levels

Overview
Today last price1.0505
Today Daily Change-27 pips
Today Daily Change %-0.26%
Today daily open1.0532
 
Trends
Daily SMA201.0567
Daily SMA501.0587
Daily SMA1001.0507
Daily SMA2001.0603
Levels
Previous Daily High1.0556
Previous Daily Low1.0505
Previous Weekly High1.0591
Previous Weekly Low1.0495
Previous Monthly High1.0728
Previous Monthly Low1.052
Daily Fibonacci 38.2%1.0524
Daily Fibonacci 61.8%1.0537
Daily Pivot Point S11.0506
Daily Pivot Point S21.048
Daily Pivot Point S31.0455
Daily Pivot Point R11.0557
Daily Pivot Point R21.0582
Daily Pivot Point R31.0608

Author

Anil Panchal

Anil Panchal

FXStreet

Anil Panchal has nearly 15 years of experience in tracking financial markets. With a keen interest in macroeconomics, Anil aptly tracks global news/updates and stays well-informed about the global financial moves and their implications.

More from Anil Panchal
Share:

Editor's Picks

EUR/USD tests nine-day EMA support near 1.1850

EUR/USD remains in the negative territory for the fourth successive session, trading around 1.1870 during the Asian hours on Friday. The 14-day Relative Strength Index momentum indicator at 56 stays above the midline, confirming steady momentum. RSI has eased but remains above 50, indicating momentum remains constructive for the bulls.

GBP/USD consolidates around 1.3600 vs. USD; looks to US CPI for fresh impetus

The GBP/USD pair remains on the defensive through the Asian session on Friday, though it lacks bearish conviction and holds above the 1.3600 mark as traders await the release of the US consumer inflation figures before placing directional bets.

Gold recovers swiftly from weekly low, climbs back closer to $5,000 ahead of US CPI

Gold regains positive traction during the Asian session on Friday and recovers a part of the previous day's heavy losses to the $4,878-4,877 region, or the weekly low. The commodity has now moved back closer to the $5,000 psychological mark as traders keenly await the release of the US consumer inflation figures for more cues about the Federal Reserve's policy path.

Solana: Mixed market sentiment caps recovery

Solana is trading at $79 as of Friday, following a correction of over 9% so far this week. On-chain and derivatives data indicates mixed sentiment among traders, further limiting the chances of a price recovery.

A tale of two labour markets: Headline strength masks underlying weakness

Undoubtedly, yesterday’s delayed US January jobs report delivered a strong headline – one that surpassed most estimates. However, optimism quickly faded amid sobering benchmark revisions.

Solana Price Forecast: Mixed market sentiment caps recovery

Solana (SOL) is trading at $79 as of Friday, following a correction of over 9% so far this week. On-chain and derivatives data indicates mixed sentiment among traders, further limiting the chances of a price recovery.