- AUD/NZD pulls back on Monday from 1.0750, but is still primed for further topside.
- 1.0650 continues to hold as a firm technical floor for the pair.
The AUD/NZD is getting hamstrung in the midrange as intraday price action gets caught in the negative space between the 50-hour and 200-hour Simple Moving Averages (SMA) after a near-term bullish crossover of the intraday moving averages.
The Aussie (AUD) saw a bullish rebound last week, taking the AUD/NZD back into the 1.0740 level after waffling to a seven-week low near 1.0650. Sideways momentum has been the overall trend for the AUD/NZD through most of 2023, but the pair remains down from late November’s last swing high into 1.0860, leaving the door open for near-term bullish plays.
Australian Dollar price this week
The table below shows the percentage change of Australian Dollar (AUD) against listed major currencies this week. Australian Dollar was the strongest against the Japanese Yen.
USD | EUR | GBP | CAD | AUD | JPY | NZD | CHF | |
USD | -0.01% | -0.02% | -0.05% | 0.24% | 0.78% | 0.01% | -0.15% | |
EUR | 0.01% | -0.02% | -0.04% | 0.24% | 0.77% | 0.01% | -0.14% | |
GBP | 0.03% | 0.02% | -0.02% | 0.26% | 0.80% | 0.03% | -0.12% | |
CAD | 0.05% | 0.04% | 0.02% | 0.28% | 0.83% | 0.05% | -0.10% | |
AUD | -0.24% | -0.24% | -0.26% | -0.28% | 0.53% | -0.23% | -0.38% | |
JPY | -0.78% | -0.79% | -0.90% | -0.84% | -0.54% | -0.78% | -0.94% | |
NZD | -0.01% | -0.01% | -0.03% | -0.05% | 0.22% | 0.76% | -0.14% | |
CHF | 0.15% | 0.14% | 0.12% | 0.10% | 0.38% | 0.93% | 0.15% |
The heat map shows percentage changes of major currencies against each other. The base currency is picked from the left column, while the quote currency is picked from the top row. For example, if you pick the Euro from the left column and move along the horizontal line to the Japanese Yen, the percentage change displayed in the box will represent EUR (base)/JPY (quote).
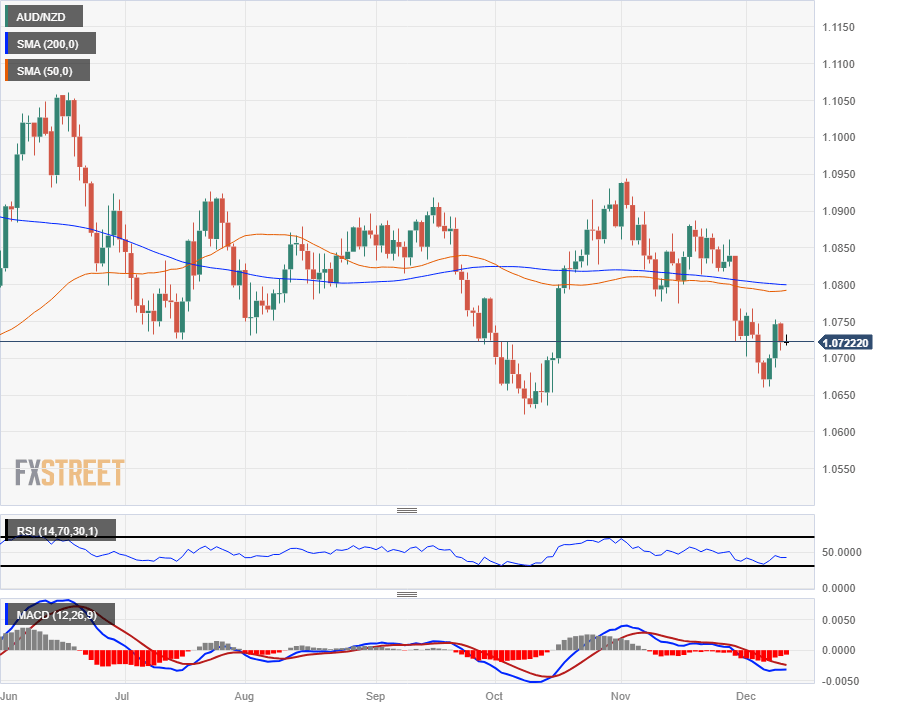
Daily candlesticks look notably sideways for the AUD/NZD, with the pair channeling around the 200-day SMA near the 1.0800 handle. 1.0650 represents a notable technical support region for the pair with multiple rebound zones baked into the price level, and a bullish extension will see the pair taking a fresh run at a long-running technical resistance zone near 1.0900 that has vexed long-term Aussie bulls for most of the year.
Moving averages and technical indicators are mechanically breaking with long-term midrange chart action limiting data series, and the 50-day and 200-day SMAs are drifting in parallel near the 1.0800 handle.
AUD/NZD Hourly Chart
AUD/NZD Daily Chart
AUD/NZD Technical Levels
Information on these pages contains forward-looking statements that involve risks and uncertainties. Markets and instruments profiled on this page are for informational purposes only and should not in any way come across as a recommendation to buy or sell in these assets. You should do your own thorough research before making any investment decisions. FXStreet does not in any way guarantee that this information is free from mistakes, errors, or material misstatements. It also does not guarantee that this information is of a timely nature. Investing in Open Markets involves a great deal of risk, including the loss of all or a portion of your investment, as well as emotional distress. All risks, losses and costs associated with investing, including total loss of principal, are your responsibility. The views and opinions expressed in this article are those of the authors and do not necessarily reflect the official policy or position of FXStreet nor its advertisers. The author will not be held responsible for information that is found at the end of links posted on this page.
If not otherwise explicitly mentioned in the body of the article, at the time of writing, the author has no position in any stock mentioned in this article and no business relationship with any company mentioned. The author has not received compensation for writing this article, other than from FXStreet.
FXStreet and the author do not provide personalized recommendations. The author makes no representations as to the accuracy, completeness, or suitability of this information. FXStreet and the author will not be liable for any errors, omissions or any losses, injuries or damages arising from this information and its display or use. Errors and omissions excepted.
The author and FXStreet are not registered investment advisors and nothing in this article is intended to be investment advice.
Recommended content
Editors’ Picks
EUR/USD holds above 1.0700 ahead of US jobs report
EUR/USD stays in a consolidation phase above 1.0700 after closing the previous two days in positive territory. Investors eagerly await April jobs report from the US, which will include Nonfarm Payrolls and Unemployment Rate readings.
GBP/USD advances to 1.2550, all eyes on US NFP data
The GBP/USD pair trades on a stronger note around 1.2550 amid the softer US Dollar on Friday. Market participants refrain from taking large positions as focus shifts to April Nonfarm Payrolls and ISM Services PMI data from the US.
Gold remains stuck near $2,300 ahead of US NFP
Gold price struggles to gain any meaningful traction and trades in a tight channel near $2,300. The Fed’s less hawkish outlook drags the USD to a multi-week low and lends support to XAU/USD ahead of the key US NFP data.
XRP edges up after week-long decline as Ripple files letter in reply to SEC’s motion
Ripple filed a letter to the court to support its April 22 motion to strike new expert materials. The legal clash concerns whether SEC accountant Andrea Fox's testimony should be treated as a summary or expert witness.
US NFP Forecast: Nonfarm Payrolls gains expected to cool in April
The NFP report is expected to show that the US economy added 243,000 jobs last month, sharply lower than the 303,000 job creation seen in March. The Unemployment Rate is set to stay unchanged at 3.8% in the same period.