|

AUD/NZD Price Analysis: Renews monthly low around 1.0800 on downbeat Australia CPI

  • AUD/NZD drops 50 pips to refresh multi-day low after Australia’s Monthly CPI for May disappoints.
  • Nearly oversold RSI, fortnight-old support line challenge bears at monthly low.
  • Bulls need successful break of three-week-old horizontal resistance to retake control.

AUD/NZD slumps 50 pips to refresh the monthly low around 1.0800 after Australia’s headline inflation data disappoint the buyers on early Wednesday. That said, the pair rebounds to 1.0825 following the data.

That said, Australia’s Monthly Consumer Price Index (CPI) for May drops to 5.6% YoY versus 6.1% expected and 6.8% prior. The same amplifies concerns about the Reserve Bank of Australia’s (RBA) pause in the rate hikes after two consecutive hawkish surprises, which in turn drowns the Australian Dollar (AUD) versus other currencies.

It should be noted that the improvement in China Industrial Profits for May, -12.6% YoY versus -18.2% prior, appeared to have a put a floor under the AUD/JPY price after the Aussie inflation data.

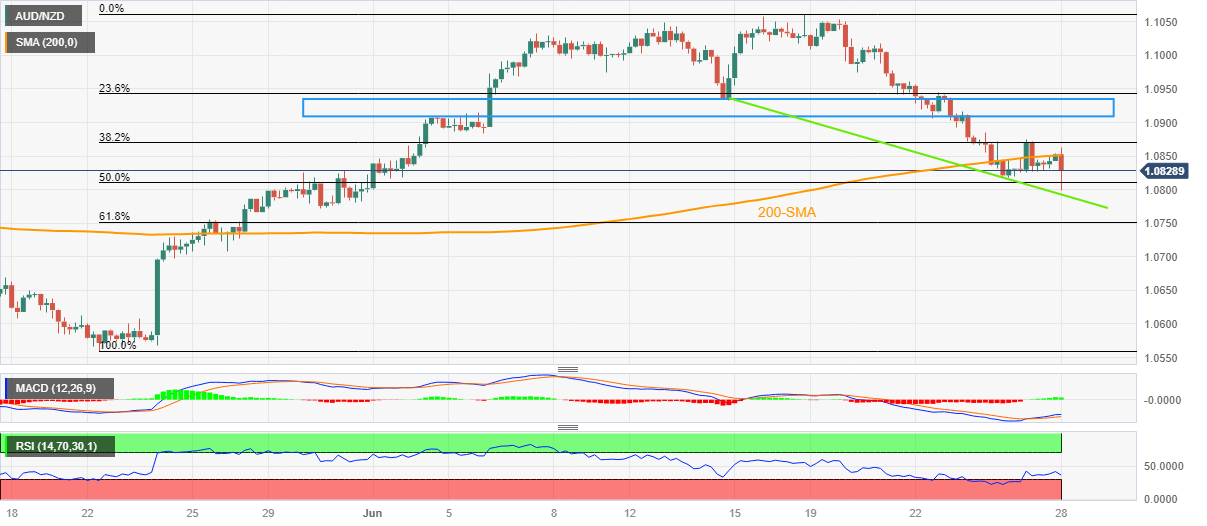
Technically, the nearly oversold RSI conditions join the two-week-old falling support line to trigger the quote’s latest bounce. However, the 200-SMA restricts the immediate upside of the pair near 1.0850.

Following that, a broad resistance zone comprising multiple levels marked since early June, near 1.0910-35, will be a tough nut to crack for the AUD/NZD bulls.

Meanwhile, a downside break of the immediate support line, close to 1.0790 by the press time, will direct the AUD/NZD price to the 61.8% Fibonacci retracement of the May-June upside, near 1.0750.

In a case where the exotic pair remains bearish past 1.0750, the 1.0700 round figure may act as the last defense of the bulls.

AUD/NZD: Four-hour chart

Trend: Corrective bounce expected

Additional important levels

Overview
Today last price1.0817
Today Daily Change-0.0033
Today Daily Change %-0.30%
Today daily open1.085
 
Trends
Daily SMA201.0951
Daily SMA501.0816
Daily SMA1001.0816
Daily SMA2001.0871
 
Levels
Previous Daily High1.0874
Previous Daily Low1.0825
Previous Weekly High1.1062
Previous Weekly Low1.0866
Previous Monthly High1.0834
Previous Monthly Low1.056
Daily Fibonacci 38.2%1.0856
Daily Fibonacci 61.8%1.0844
Daily Pivot Point S11.0825
Daily Pivot Point S21.0801
Daily Pivot Point S31.0776
Daily Pivot Point R11.0875
Daily Pivot Point R21.0899
Daily Pivot Point R31.0924

Author

Anil Panchal

Anil Panchal

FXStreet

Anil Panchal has nearly 15 years of experience in tracking financial markets. With a keen interest in macroeconomics, Anil aptly tracks global news/updates and stays well-informed about the global financial moves and their implications.

More from Anil Panchal
Share:

Editor's Picks

AUD/USD consolidates above 0.7000/two-month low; bearish potential intact

The AUD/USD pair oscillates in a narrow range during the Asian session, and moves little following the release of mixed inflation figures from China. Spot prices currently trade around the 0.7025 region, nearly unchanged for the day, and remain within striking distance of a nearly two-month low set on Tuesday. Renewed hostilities between the US and Iran temper hopes for a deal to end the over three-month-old war.

Japanese Yen languishes despite wholesale inflation accelerates in May

USD/JPY flatlines after experiencing volatility, trading around 160.40 during the Asian hours on Wednesday. The pair continues to hold its ground, reflecting a struggling Japanese Yen that has failed to find support despite a massive acceleration in wholesale inflation. Driven by surging energy costs linked to the ongoing Middle East conflict, Japan’s Producer Price Index jumped 6.3% year-over-year in May. This hot printing comfortably outpaced April’s upwardly revised 5.3% figure and surpassed market consensus of 5.5%, marking the fastest pace of wholesale price growth in three years.

Gold plummets below $4,200 amid US‑Iran tensions ahead of US CPI

Gold extends the recent breakdown momentum below a technically significant 200-day Simple Moving Average (SMA) and drops to a fresh low since March 23, further below the $4,200 mark during the Asian session. Crude Oil prices rise amid renewed hostilities between the US and Iran, fueling inflation fears and bolstering bets for more hawkish central banks.

Bitcoin remains vulnerable, Ethereum weakens further, XRP signals more downside

Bitcoin, Ethereum, and Ripple remain under pressure mid-week, as the broader cryptocurrency market struggles to regain recovery momentum after last week’s massive correction. BTC struggles below $62,000, ETH continues to weaken below $1,650, while XRP’s momentum indicators remain biased toward further downside.

US CPI data set to show inflation at three-year high in May, backing Fed hawkish tilt

The US Bureau of Labor Statistics will publish the May Consumer Price Index (CPI) data on Wednesday. The report is expected to show another step up in consumer inflation, driven by the persistently high Oil prices due to the ongoing crisis in the Middle East.

The US economy defies the rules: 100 days into the Oil shock and the recession signal is still missing

More than three months after the start of the Iran war and the resulting disruption to global energy markets, the US economy continues to display remarkable resilience. The conflict has triggered a sharp rise in Oil prices, reignited inflationary pressures and fueled widespread concerns about a potential economic slowdown.