AUD/NZD Price Analysis: getting pushed towards the middle once more, 1.08 in sight
- The AUD/NZD has been stepping down through November as the Aussie loses momentum.
- Short-term interest could see a bounce back into the median range.
- Longer-term sees significant pressure to return to familiar swing low pattern.

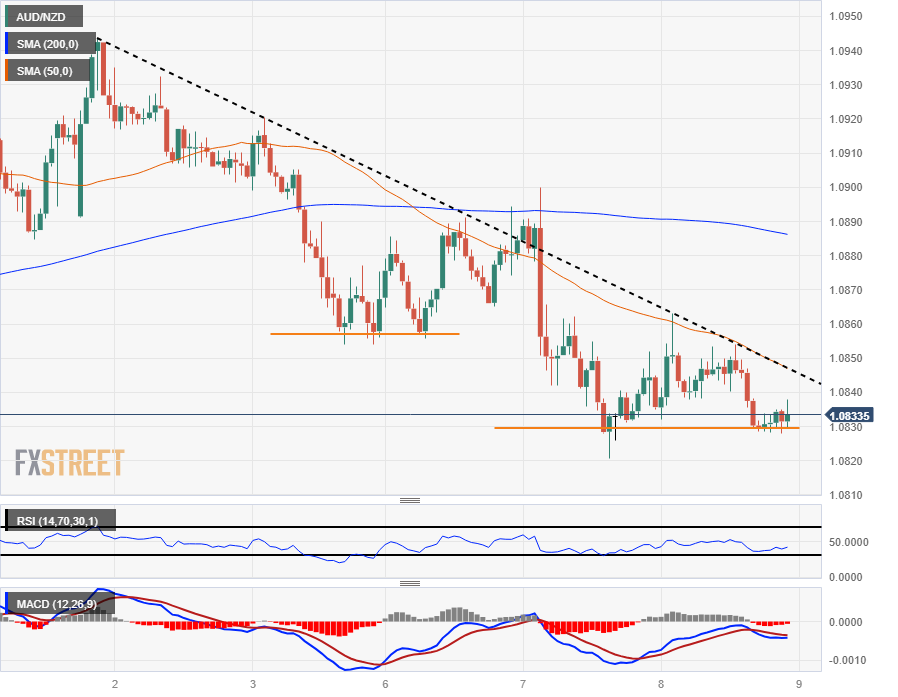
The AUD/NZD is trading into two-week lows as the Aussie (AUD) grapples against a technical rebound on the Kiwi (NZD) side of the pair.
A lower low pattern on the intraday charts has bullish momentum draining out of the Aussie as the pair has slumped below the 200-hour Simple Moving Average (SMA), implying bearish traversal is set to continue.
The 50-hour SMA has been capping off intraday upside corrections since crossing over the 200-hour SMA at the start of the week, and a technical correction above the 50-day SMA could evolve into a false breakout.
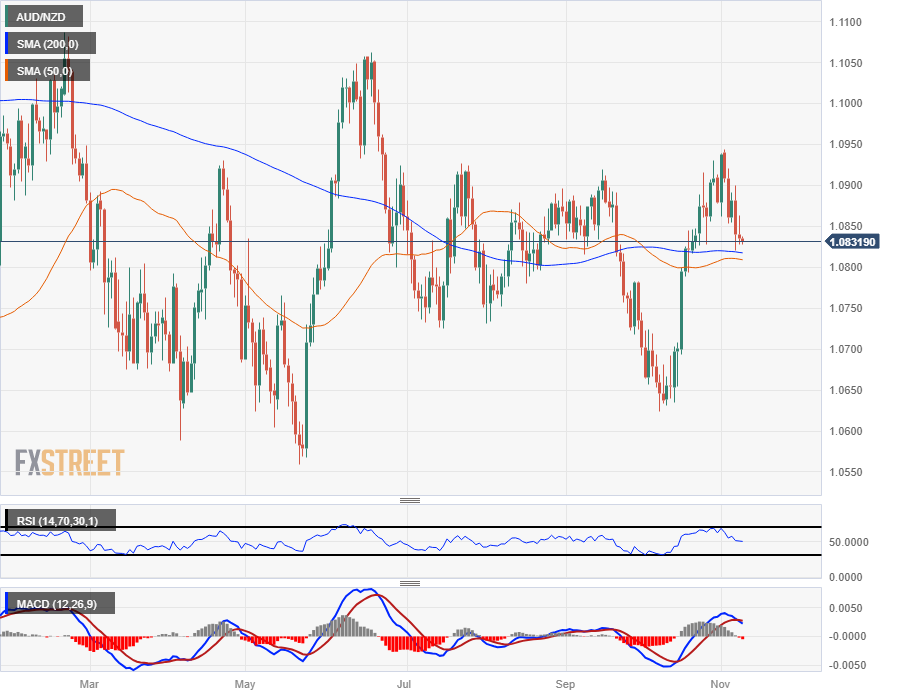
On the longer timeframes, daily candlesticks have the AUD/NZD backsliding into the 200-day SMA currently grinding sideways just north of the 1.0800 handle.
The last bullish run-up from October's lows just south of 1.0650 saw the pair quickly run out of gas near 1.0950 and is now heading back towards the midrange, and the 50-day SMA is beginning to turn downwards while still trapped in bearish territory still below the 200-day SMA.
Australian Dollar price this week
The table below shows the percentage change of Australian Dollar (AUD) against listed major currencies this week. Australian Dollar was the weakest against the Swiss Franc.
| USD | EUR | GBP | CAD | AUD | JPY | NZD | CHF | |
| USD | 0.22% | 0.72% | 0.98% | 1.76% | 0.93% | 1.44% | 0.00% | |
| EUR | -0.22% | 0.52% | 0.77% | 1.55% | 0.72% | 1.21% | -0.19% | |
| GBP | -0.72% | -0.51% | 0.27% | 1.04% | 0.20% | 0.71% | -0.74% | |
| CAD | -0.97% | -0.77% | -0.25% | 0.80% | -0.04% | 0.47% | -0.98% | |
| AUD | -1.78% | -1.55% | -1.04% | -0.78% | -0.83% | -0.31% | -1.78% | |
| JPY | -0.96% | -0.74% | -0.46% | 0.06% | 0.79% | 0.51% | -0.94% | |
| NZD | -1.46% | -1.23% | -0.71% | -0.46% | 0.29% | -0.52% | -1.46% | |
| CHF | 0.00% | 0.20% | 0.72% | 0.96% | 1.73% | 0.94% | 1.44% |
The heat map shows percentage changes of major currencies against each other. The base currency is picked from the left column, while the quote currency is picked from the top row. For example, if you pick the Euro from the left column and move along the horizontal line to the Japanese Yen, the percentage change displayed in the box will represent EUR (base)/JPY (quote).
AUD/NZD Hourly Chart
AUD/NZD Daily Chart
AUD/NZD Technical Levels
Author

Joshua Gibson
FXStreet
Joshua joins the FXStreet team as an Economics and Finance double major from Vancouver Island University with twelve years' experience as an independent trader focusing on technical analysis.


