AUD/NZD middles ahead of RBA minutes, NZ GDP in the pipe for Wednesday
- The AUD/NZD lacks conviction for Monday, ending near where it started.
- The RBA is due early Tuesday with a new face at the helm of the organization.
- NZ GDP, Aussie PMIs to round out the thin data week.

The AUD/NZD pair spread to the middle for Monday, unable to develop momentum as the Reserve Bank of Australia (RBA) comes in for a landing early Tuesday.
The RBA held rates on pause for the third straight month at the Australian central bank’s last meeting, which was also the last appearance of Phillip Lowe as the RBA’s Governor.
Former Deputy Governor Michelle Bullock replaces Lowe at the helm of the RBA today. Markets are broadly not expecting Bullock to rock the boat with any policy changes for her first appearance as the RBA’s Governor.
Lowe's out, Bullock's in at the RBA
Governor Bullock has already stated that the RBA’s stance moving forward will be firmly data-dependent, and Governor Bullock will be preoccupied with significant structural changes underway at the RBA.
At the urging of the Australian government, the RBA will be implementing operational adjustments that are expected to streamline the central bank. Most notably, the RBA will be moving to a twice-quarterly appearance schedule, from the current monthly outing.
Wednesday will bring New Zealand’s Gross Domestic Product (GDP) figures into focus. Quarter-on-quarter figures for the diminutive Antipodean economy last printed a meager 0.1% decline, and Kiwi traders will want to keep an eye on the updated figures for 2023’s second quarter.
NZ trade balance figures and Australia’s Purchasing Manager Index (PMI) data will also be dropping on Thursday to round out the week’s Oceania economic data docket.
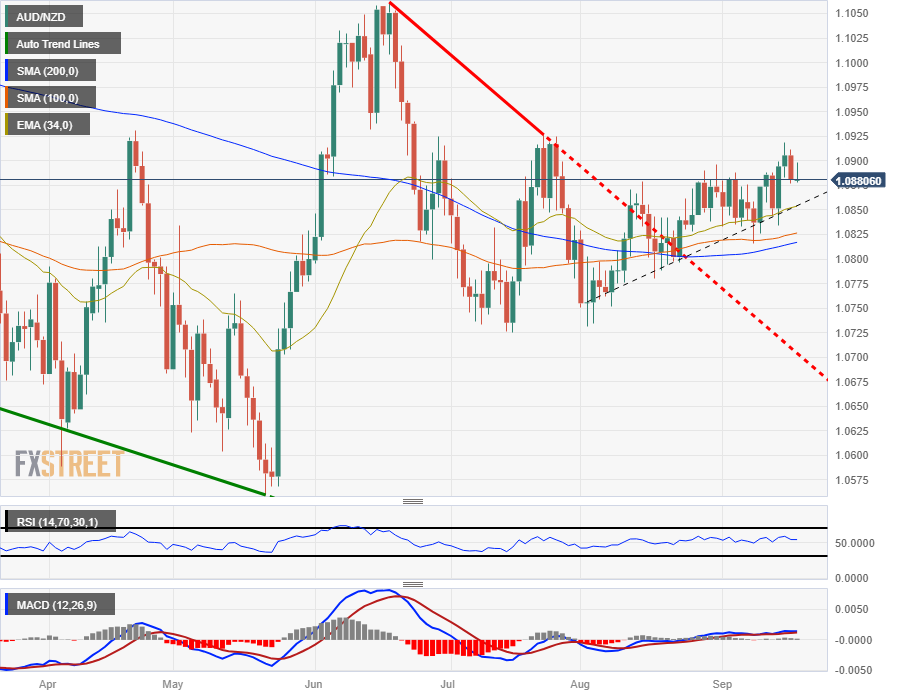
AUD/NZD technical outlook
The AUD/NZD pair has twisted to the upside in recent weeks, clipping into a seven-week high last Thursday, but the Aussie-Kiwi pairing remains constrained by unconvinced market sentiment in either direction.
Daily candlesticks have the pair supported by the 200-day Simple Moving Average (SMA) from 1.0817. Higher lows from August’s opening prices near 1.0750 are bolstering upside gains, with price action getting a bump from the 34-day Exponential Moving Average climbing into the 1.0850 neighborhood.
AUD/NZD daily chart
AUD/NZD technical levels
Author

Joshua Gibson
FXStreet
Joshua joins the FXStreet team as an Economics and Finance double major from Vancouver Island University with twelve years' experience as an independent trader focusing on technical analysis.


