|

AUD/NZD dips, holding near 1.0850 ahead of Thursday’s Aussie employment figures

  • The AUD/NZD slips back into consolidation ranges as the Aussie lacks momentum.
  • Australian employment figures in the pipe will hopefully drive some fresh sentiment shifts.
  • China data on Friday could produce knock-on effects for the AUD.

The AUD/NZD backslid to a daily low of 1.0840 in Wednesday’s trading, with the Aussie (AUD) backing up ahead of inbound labor market data due in the Thursday trading window. The Kiwi (NZD) remained relatively on balance, unmoved by a notable lack of economic calendar data on the docket for the New Zealand currency.

Aussie unemployment rate expected to hold steady

Markets are broadly expecting Australia’s Unemployment Rate to hold steady at 3.7% for the month of August, holding steady at the previous month’s figure. 

Meanwhile, Australian Employment Change for the month of August is expected to tick higher, with market analysts anticipating a printing of 23K, versus the previous period’s reading of a 14.6K decline.

The Kiwi remains under-represented on the economic calendar, but China data due on Friday, including Chinese Industrial Production figures and annualized Retail Sales for August, could see the Aussie gain some momentum with knock-on market effects.

China’s YoY Retail Sales for the month of August are expected to move upwards, from 2.5% to 3%, while Chinese Industrial Production figures are also expected to improve, forecast to print at 3.9% versus the previous 3.5%.

AUD/NZD Technical outlook

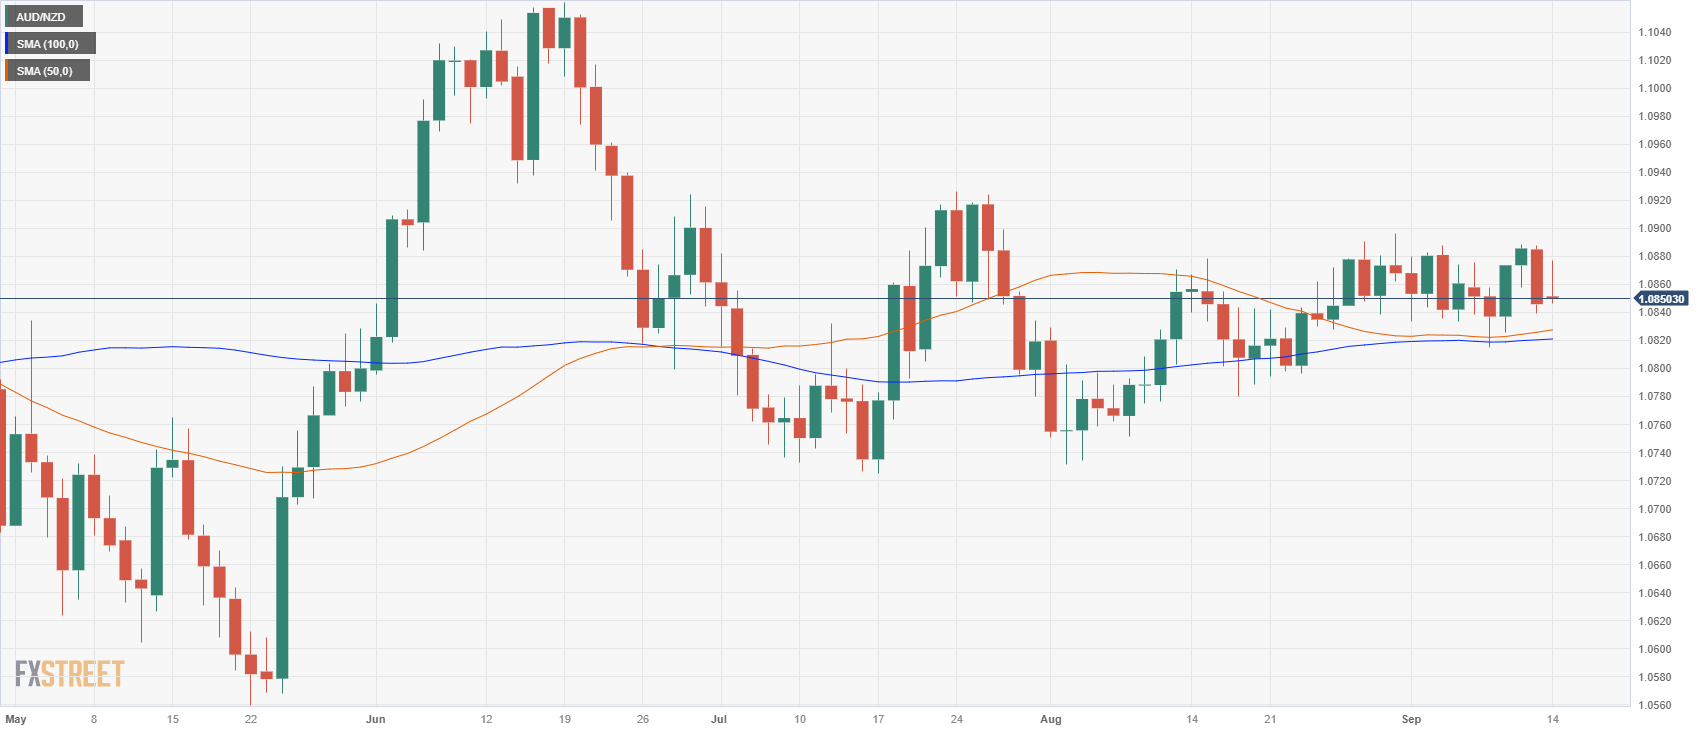
The AUD/NZD remains trapped firmly in the middle, with Wednesday’s Aussie slip into the red sending the pair firmly back into the recent consolidation region. The 100-day Simple Moving Average (SMA) continues to provide support for the longer candlestick periods, but the 50-day SMA continues to consolidate, reinforcing the middling patterns on the Aussie-Kiwi charts.

The current ceiling rests at the last meaningful swing high near 1.0920 in late July, with the floor priced in at early August’s drop-and-rebound from 1.0740.

AUD/NZD daily chart
AUD/NZD technical levels

AUD/NZD

Overview
Today last price1.084
Today Daily Change-0.0046
Today Daily Change %-0.42
Today daily open1.0886
 
Trends
Daily SMA201.0847
Daily SMA501.0824
Daily SMA1001.082
Daily SMA2001.081
 
Levels
Previous Daily High1.0888
Previous Daily Low1.0858
Previous Weekly High1.0888
Previous Weekly Low1.0815
Previous Monthly High1.0897
Previous Monthly Low1.0732
Daily Fibonacci 38.2%1.0877
Daily Fibonacci 61.8%1.087
Daily Pivot Point S11.0866
Daily Pivot Point S21.0847
Daily Pivot Point S31.0836
Daily Pivot Point R11.0897
Daily Pivot Point R21.0908
Daily Pivot Point R31.0927


Author

Joshua Gibson

Joshua joins the FXStreet team as an Economics and Finance double major from Vancouver Island University with twelve years' experience as an independent trader focusing on technical analysis.


More from Joshua Gibson
Share:

Editor's Picks

AUD/USD breaks below 0.7000 ahead of inflation data

AUD/USD has accelerated its downward trend on Tuesday, breaching below the key 0.7000 yardstick ahead of the opening bell in Asia on Wednesday. Indeed, spot has retreated for the second day in a row despite the hawkish hike by the RBA early on Tuesday and in response to the continuation of the move higher in the Greenback. Looking ahead, all the attention will be on the release of Australia’s inflation data on Wednesday.

USD/JPY consolidates near 157.50 as a bullish USD counters intervention risks

USD/JPY struggles to capitalize on the overnight bounce from a one-week low, consolidating around 157.50 in the Asian session on Tuesday. Trump's concerns about the Japanese Yen's weakness fueled speculation about another US-Japan joint intervention. This, along with the hawkish BoJ, underpins the JPY and caps the currency pair. Meanwhile, rising Fed rate-hike bets and oil-driven inflation fears continue to push US bond yields to multi-year highs, keeping the US Dollar pinned near a two-month high and supporting the pair.

Gold trims gains; back toward $4,150

Gold now surrenders some of its initial advance and retests the $4,150 zone per troy ounce on Tuesday. Meanwhile, the move higher in the yellow metal comes despite the firmer US Dollar and rising US Treasury yields across the board, while escalating geopolitical tensions appear to limit the downside potential.

XRP advances within a robust technical structure
Ripple (XRP) shows signs of stabilizing after reclaiming support at $1.50 on Tuesday. A robust technical structure underpins the token’s short to medium-term bullish outlook. Still, XRP is not out of the woods yet, as profit-taking and buyer exhaustion could weigh on price action and extend the recent correction from September highs around $1.66.
RBA recap: Rate hikes are on the table as demand stays too strong

The Reserve Bank of Australia unanimously tightened monetary policy, warning that inflation remained too high and that several upside risks had begun to materialise. Governor Michele Bullock said the Board would raise rates again if necessary.

Silver is more volatile than Gold ahead of PCE and NFP. This chart shows the positioning gap
The market’s attention is focused on American data this week, but there’s something only those with a trained eye may be looking at: Gold and Silver positioning gap. Financial markets are moving on fears, mostly related to persistently high energy prices driven by the Middle East war. Sure, the US Dollar (USD) is strong, but at what cost?