AUD/JPY Price Analysis: Retreats from 83.80 amid risk-off market sentiment
- AUD/JPY reaches a fresh three-month high around the 83.80 range.
- AUD/JPY: A Doji in the daily chart depicts that the pair might correct lower before resuming the uptrend, supported by momentum indicators.

The AUD/JPY is trading unchanged as the Asian session begins and is trading at 83.48, barely down 0.01%, during the day at the time of writing. The market sentiment is mixed, as depicted by Asian equity futures, seesawing between gainers and losers.
AUD/JPY Price Forecast: Technical outlook
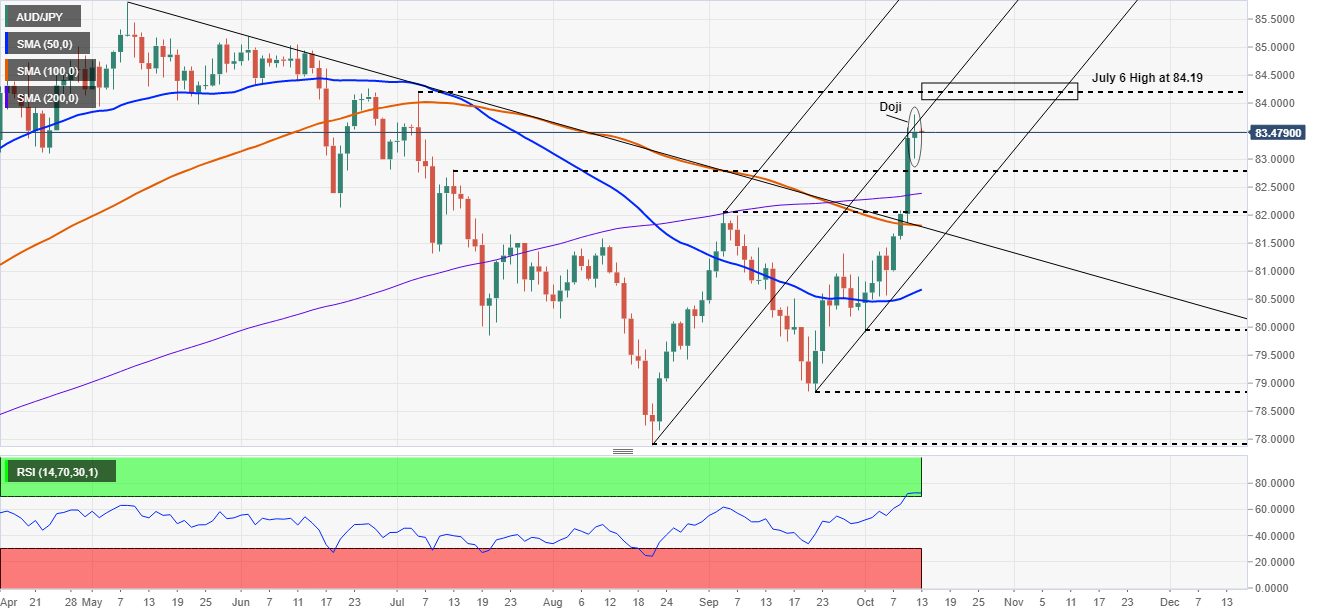
Daily chart
On Tuesday, the AUD/JPY reached 83.80 above the middle of the Andrew Pitchfork channel, but strong seeling pressure capped the move, retreating the cross-currency to 83.50. A breach of the latter could accelerate an upside move towards the July 6 high at 84.19, but oversold levels at the Relative Strength Index (RSI) at 73, suggests the pair could be headed for a correction towards the 200-day moving average (DMA) at 82.37, before resuming a move towards higher prices. Nevertheless, in case of a push below the 200-DMA, the September 3 high at 82.02 will be the next support before reaching the 100-DMA at 81.83.
Worth notice: the October 12 price action portrayed a Doji in the middle of the Pitchfork channel, meaning the pair could reverse the upward trend.
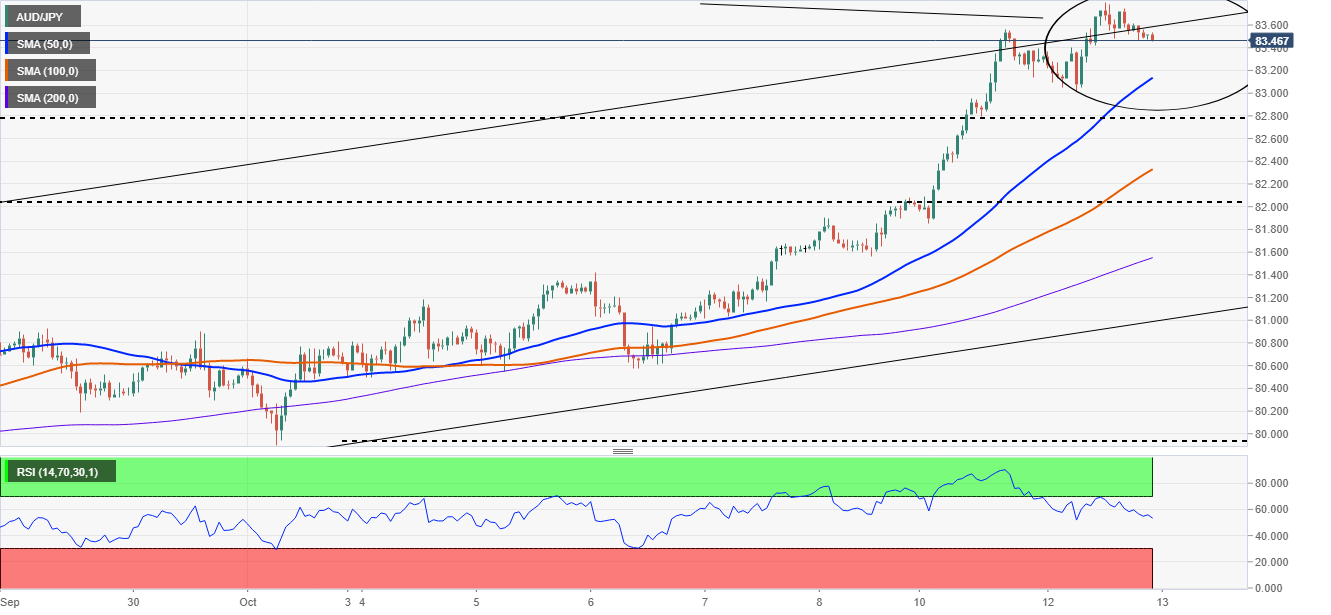
1-hour chart
The AUD/JPY is trading within a narrow range between 83.50-83.80. A break beyond the upside level could open the way towards 84.00. However, the Relative Strength Index at 53, suggesting that an upside move might be on the cards. Failure to an upside break could signal that consolidation or a correction could lie ahead for the AUD/JPY in the near term.
On the flip side, a break beneath the bottom level will find the daily pivot at 83.41 as the first support level, followed by the 83.00 psychological level. A breach beneath the latter would exert downward pressure on the pair towards the confluence of the 50-simple moving average (SMA) and the S1 pivot level around the 83.12-83.22 area.
Author

Christian Borjon Valencia
FXStreet
Markets analyst, news editor, and trading instructor with over 14 years of experience across FX, commodities, US equity indices, and global macro markets.


