|

AUD/JPY Price Analysis: Prints a new 7-year high around 95.60s

  • The AUD/JPY reached a seven-year-old new high at 95.66, but it retraced some as the Asian Pacific session began.
  • Despite verbal intervention by the Japanese Minister of Finance, most crosses rose against the battered Japanese yen.
  • AUD/JPY Price Forecast: Upward biased, but oscillators approach overbought conditions.

The Australian dollar extends its rally against the Japanese yen, taking advantage of a dovish Bank of Japan (BoJ), despite comments from the Japanese Finance Minister Suzuki. At the time of writing, the AUD/JPY is trading at 95.48.

On Tuesday, the Minister of Finance Suzuki said that a weaker yen brought more demerit than merit and emphasized that they would continue monitoring the FX market with a sense of vigilance. Nevertheless, market participants widely ignored his comments, as the USD/JPY rose 1.49%, the EUR/JPY gained 1.55%, and the AUD/JPY rallied 1.83%.

AUD/JPY Price Forecast: Technical outlook

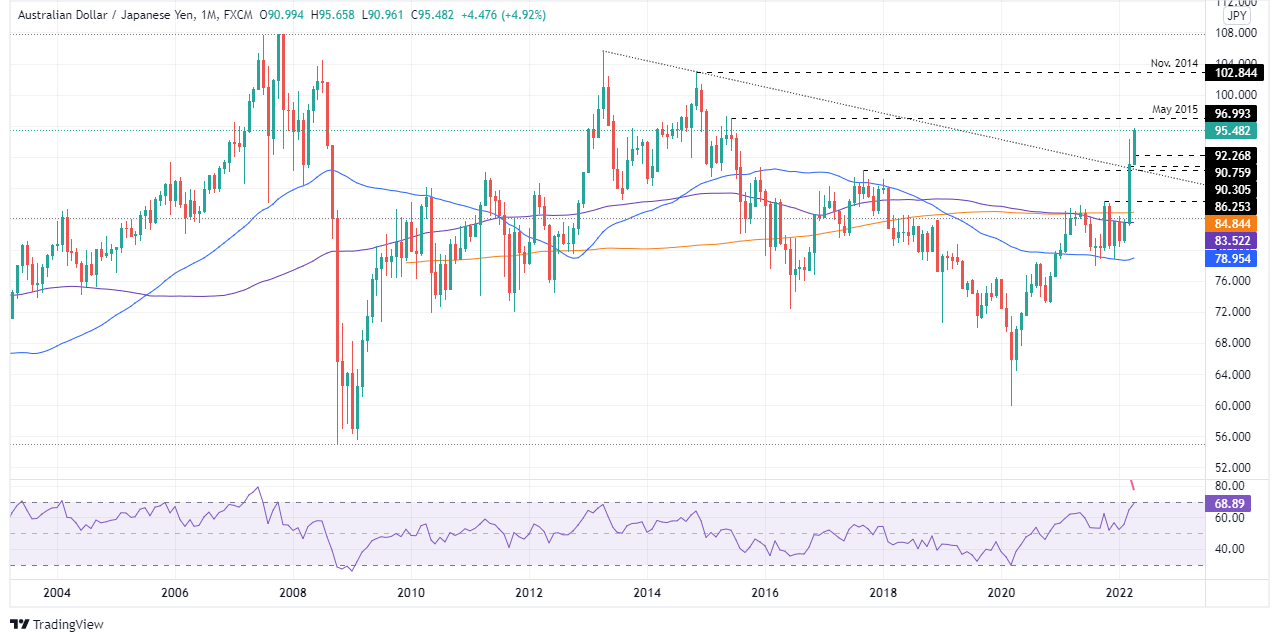
The AUD/JPY monthly chart depicts the pair as upward biased, further confirmed by the break of a nine-year-old downslope trendline in March. Nevertheless, the steepness of the rally is beginning to show on oscillators indicators, like the Relative Strength Index (RSI), which illustrates an almost vertical move towards overbought conditions, though still short at 68.87.

To the upside, the AUD/JPY’s first resistance would be May 2015 highs around 97.30. Once cleared, the next resistance would be the 100.00 mark, and then the November 2014 highs near 102.84. On the flip side, the AUD/JPY first support would be the abovementioned downslope trendline around the 90.50-70 area. A breach of the latter would pave the way for further losses. The following support would be the October 2021 highs around 86.25 and then the 200-month simple moving average (SMA) at 84.84.

Key technical levels

AUD/JPY

Overview
Today last price95.48
Today Daily Change2.17
Today Daily Change %2.33
Today daily open93.31
 
Trends
Daily SMA2092.46
Daily SMA5087.48
Daily SMA10084.71
Daily SMA20083.29
 
Levels
Previous Daily High93.72
Previous Daily Low93.08
Previous Weekly High93.87
Previous Weekly Low92.47
Previous Monthly High94.32
Previous Monthly Low83.1
Daily Fibonacci 38.2%93.33
Daily Fibonacci 61.8%93.48
Daily Pivot Point S193.02
Daily Pivot Point S292.73
Daily Pivot Point S392.38
Daily Pivot Point R193.66
Daily Pivot Point R294.01
Daily Pivot Point R394.3

Author

Christian Borjon Valencia

Markets analyst, news editor, and trading instructor with over 14 years of experience across FX, commodities, US equity indices, and global macro markets.

More from Christian Borjon Valencia
Share:

Editor's Picks

GBP/USD bounces off lows, back above 1.3200

After bottoming out near 1.3160, GBP/USD manages to regain a bit of shine and reclaim the 1.3200 mark and beyond at the end of the week. Stronger-than-expected UK Retail Sales data seem to be helping the British Pound limit its losses, while the chaotic UK political environment keeps the bulls at bay for now.

EUR/USD looks consolidative around 1.1460

EUR/USD stages a modest rebound after slipping to a three-month low below 1.1420 at the end of the week. That said, the pair now looks to consolidate humble gains just above 1.1460 despite growing uncertainty surrounding the next round of US-Iran negotiations, which keeps the US Dollar’s downside contained.

Gold slips back to six-day lows, targets $4,100

Gold retreats for the third consecutive day on Friday, eroding gains seen in the first half of the week and approaching the key $4,100 mark per troy ounce. Indeed, the precious metal continues to face headwinds from the Fed's hawkish stance and renewed uncertainty surrounding the next round of US-Iran negotiations.

Solana extends correction despite ETF inflows, RWA adoption

Solana (SOL) price edges below $70 extending its losses for the fourth straight day this week. The institutional demand for Solana is building, with steady inflows so far this week and Morgan Stanley’s amended S-1 filing for a Solana-focused Exchange-Traded Fund.

The Iran war didn't break the US economy, but what happens next?

Nearly four months after the start of the Iran war, the US economy remains remarkably resilient. While the conflict initially triggered a severe disruption to global energy markets and a sharp rise in Oil prices, recent diplomatic progress between Washington and Tehran has eased concerns about a prolonged supply shock.

Regime change: Inside Kevin Warsh's first move to make the Fed unreadable on purpose

The rate did not move. That was the least interesting thing about Kevin Warsh's first meeting in charge of the Fed. The FOMC held its benchmark at 3.50%-3.75% for the fourth straight meeting, exactly as priced, and then the new chair used his first press conference to dismantle the machinery the market has leaned on for a decade.