|

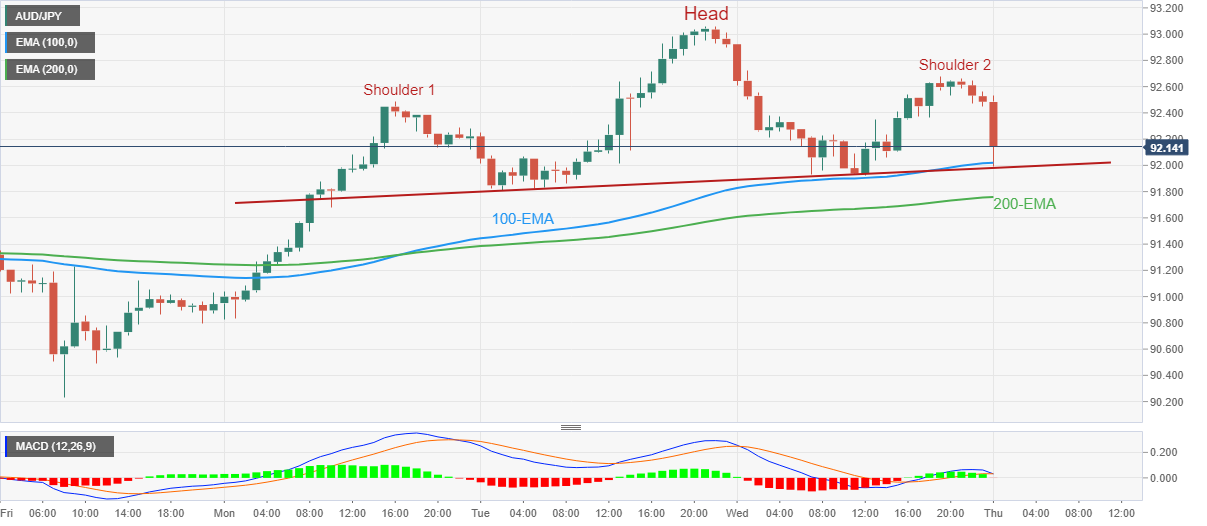
AUD/JPY Price Analysis: Portrays head-and-shoulders bearish pattern on softer Australia data

  • AUD/JPY drops 50 pips as Australia inflation, employment numbers disappoint Aussie buyers.
  • Looming bear cross on MACD adds strength to the downside bias.
  • 100-EMA, 200-EMA challenge bears before directing them to monthly low.

AUD/JPY lures sellers with an interesting head-and-shoulders bearish chart pattern following the downbeat prints of Australia’s inflation and employment numbers during early Thursday. That said, the cross-currency pair dropped nearly 50 pips to refresh an intraday low of around 92.00 by the press time.

Also read: AUD/USD plummets below 0.6900 on downbeat Aussie inflation, employment data

Not only the weekly bearish chart formation but the looming bear cross on the MACD also highlights the pair’s importance for the sellers.

However, a clear downside break of the stated pattern’s neckline, around 91.95 by the press time becomes necessary to confirm the theoretical south-run towards the 90.70 levels.

It should be noted that the 100 and 200-bar Exponential Moving Averages (EMAs) could challenge the AUD/JPY bears around 92.00 and 91.75 respectively while the monthly low surrounding 90.20 and the 90.00 round figure may please the sellers past the theoretical target.

Alternatively, recovery moves remain elusive unless the quote remains below the recent swing high of 92.67.

Even so, the monthly peak of 93.06 and the mid-December 2022 swing high of 93.35 could probe the AUD/JPY bulls.

In a case where the AUD/JPY price remains firmer past 93.35, the 94.00 round figure and October 2022 high near 95.75 will be in the spotlight.

AUD/JPY: Four-hour chart

Trend: Further downside expected

Additional important levels

Overview
Today last price92.01
Today Daily Change-0.63
Today Daily Change %-0.68%
Today daily open92.64
 
Trends
Daily SMA2091.55
Daily SMA5090.88
Daily SMA10092.19
Daily SMA20093.03
 
Levels
Previous Daily High93.06
Previous Daily Low91.92
Previous Weekly High91.96
Previous Weekly Low90.24
Previous Monthly High92.82
Previous Monthly Low87.41
Daily Fibonacci 38.2%92.36
Daily Fibonacci 61.8%92.63
Daily Pivot Point S192.02
Daily Pivot Point S291.4
Daily Pivot Point S390.88
Daily Pivot Point R193.16
Daily Pivot Point R293.68
Daily Pivot Point R394.3

Author

Anil Panchal

Anil Panchal

FXStreet

Anil Panchal has nearly 15 years of experience in tracking financial markets. With a keen interest in macroeconomics, Anil aptly tracks global news/updates and stays well-informed about the global financial moves and their implications.

More from Anil Panchal
Share:

Editor's Picks

AUD/USD consolidates above 0.7000/two-month low; bearish potential intact

The AUD/USD pair oscillates in a narrow range during the Asian session, and moves little following the release of mixed inflation figures from China. Spot prices currently trade around the 0.7025 region, nearly unchanged for the day, and remain within striking distance of a nearly two-month low set on Tuesday. Renewed hostilities between the US and Iran temper hopes for a deal to end the over three-month-old war.

Japanese Yen languishes despite wholesale inflation accelerates in May

USD/JPY flatlines after experiencing volatility, trading around 160.40 during the Asian hours on Wednesday. The pair continues to hold its ground, reflecting a struggling Japanese Yen that has failed to find support despite a massive acceleration in wholesale inflation. Driven by surging energy costs linked to the ongoing Middle East conflict, Japan’s Producer Price Index jumped 6.3% year-over-year in May. This hot printing comfortably outpaced April’s upwardly revised 5.3% figure and surpassed market consensus of 5.5%, marking the fastest pace of wholesale price growth in three years.

$4,200: Gold retains bearish bias near March low ahead of US CPI

Gold recovers slightly after touching a fresh low since March 23, though it retains a bearish bias near the $4,200 mark through the early European session. Renewed hostilities between the US and Iran fuel inflationary concerns and bolster bets for more hawkish central banks, which is seen as a key factor driving flows away from the non-yielding yellow metal. Furthermore, the decline could be attributed to technical selling following the recent breakdown below the very important 200-day SMA.

Cardano's downtrend deepens despite on-chain bottoming signals

Cardano edges lower to $0.1600 signaling a potential extension of the 30% loss from last week. The altcoin remains under intense selling pressure, weighing on its retail support. Still, a spike in dormant supply re-entering circulation signals that the selling pressure has run its course, a pattern that often precedes a rebound.

US CPI data set to show inflation at three-year high in May, backing Fed hawkish tilt

The US Bureau of Labor Statistics will publish the May Consumer Price Index (CPI) data on Wednesday. The report is expected to show another step up in consumer inflation, driven by the persistently high Oil prices due to the ongoing crisis in the Middle East.

The US economy defies the rules: 100 days into the Oil shock and the recession signal is still missing

More than three months after the start of the Iran war and the resulting disruption to global energy markets, the US economy continues to display remarkable resilience. The conflict has triggered a sharp rise in Oil prices, reignited inflationary pressures and fueled widespread concerns about a potential economic slowdown.