- AUD/JPY up 0.30%, showing bullish momentum for potential rise beyond 102.35.
- Bullish RSI indicates room for growth before hitting overbought conditions.
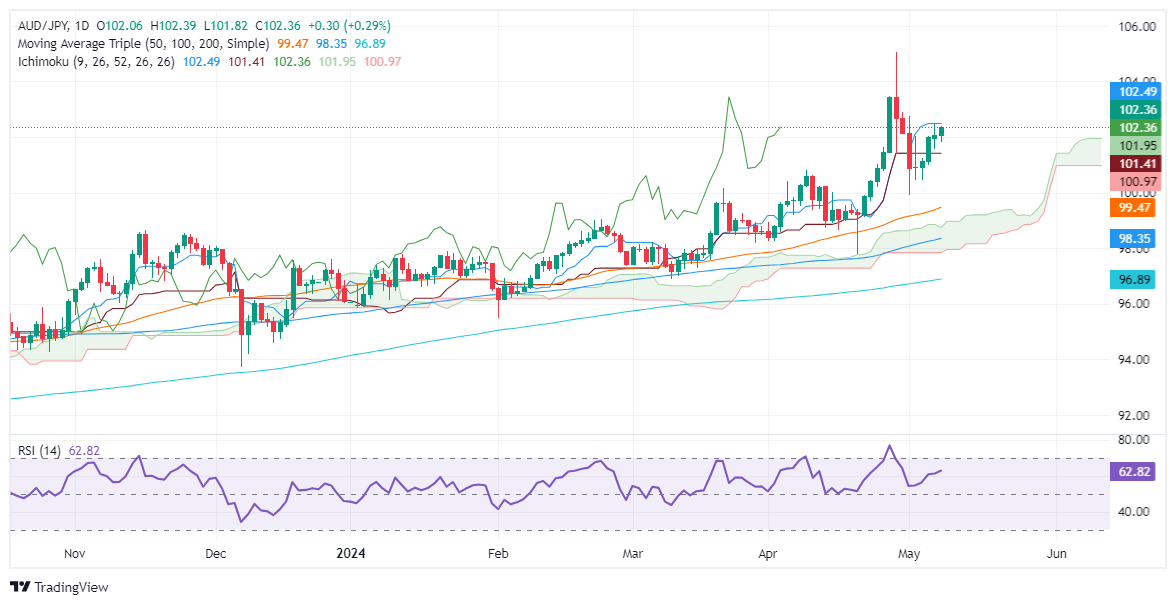
- Key levels: Resistance at Tenkan-Sen (102.42) and support at Kijun-Sen (101.36).
The AUD/JPY extends its gains for the fifth day in a row, climbs 0.30%, and trades at 102.35. Market sentiment remains upbeat, which usually weighs on the Japanese Yen (JPY) safe-haven appeal, which remains the laggard in the Forex markets against other peers.
AUD/JPY Price Analysis: Technical outlook
After reaching a year-to-date (YTD) high at 104.95, the AUD/JPY retreated towards 100.00, following a confirmed intervention by the Bank of Japan (BoJ). Since then, the pair has extended its gains, though it faces solid resistance at the Tenkan-Sen at 102.42.
Momentum favors buyers, with the Relative Strength Index (RSI) standing at bullish territory, aiming upwards with enough room before hitting overbought territory.
If AUD/JPY buyers want to re-test the YTD high, they must clear the Tenkan-Sen. Once surpassed, the 103.00 figure would emerge as the next stop, ahead of testing April’s 26 high at 103.47. Up next would be 104.00, followed by the YTD high.
On the other hand, buyers' failure to crack the Tenkan-Sen can pave the way for sellers to step in and push prices lower. The first support would be the 102.00 mark, followed by the Kijun-Sen at 101.36. Further losses are seen at the May 3 low at 100.45, followed by the 100.00 figure.
AUD/JPY Price Action – Daily Chart
Information on these pages contains forward-looking statements that involve risks and uncertainties. Markets and instruments profiled on this page are for informational purposes only and should not in any way come across as a recommendation to buy or sell in these assets. You should do your own thorough research before making any investment decisions. FXStreet does not in any way guarantee that this information is free from mistakes, errors, or material misstatements. It also does not guarantee that this information is of a timely nature. Investing in Open Markets involves a great deal of risk, including the loss of all or a portion of your investment, as well as emotional distress. All risks, losses and costs associated with investing, including total loss of principal, are your responsibility. The views and opinions expressed in this article are those of the authors and do not necessarily reflect the official policy or position of FXStreet nor its advertisers. The author will not be held responsible for information that is found at the end of links posted on this page.
If not otherwise explicitly mentioned in the body of the article, at the time of writing, the author has no position in any stock mentioned in this article and no business relationship with any company mentioned. The author has not received compensation for writing this article, other than from FXStreet.
FXStreet and the author do not provide personalized recommendations. The author makes no representations as to the accuracy, completeness, or suitability of this information. FXStreet and the author will not be liable for any errors, omissions or any losses, injuries or damages arising from this information and its display or use. Errors and omissions excepted.
The author and FXStreet are not registered investment advisors and nothing in this article is intended to be investment advice.
Recommended content
Editors’ Picks
Australian Dollar remains tepid after mixed Chinese data, Fedspeak awaited

The Australian Dollar extends its losses after mixed economic data from China on Friday. The Australian Dollar struggles as Australia’s 10-year bond yield has dropped to a monthly low of 4.2%. China’s Retail Sales increased for the consecutive 15th month but the softest gain in this sequence. The US Dollar has rebounded as the Fed remains cautious about inflation and potential rate cuts in 2024.
EUR/USD: Could FOMC Minutes provide fresh clues?

The EUR/USD pair advanced for a fourth consecutive week, comfortably trading around 1.0860 ahead of the close. Progress had been shallow, as the pair is up roughly 250 pips from the year low of 1.0600 posted mid-April.
Gold looks to extend uptrend once it confirms $2,400 as support

Gold price continued to push higher last week and rose above $2,400 on Friday, gaining nearly 2% for the week. Investors will continue to scrutinize comments from Fed officials this week and look for fresh hints on the timing of the policy pivot in the minutes of the April 30-May 1 meeting.
AI tokens could really ahead of Nvidia earnings

Native cryptocurrencies of several blockchain projects using Artificial Intelligence could register gains in the coming week as the market prepares for NVIDIA earnings report.
Week ahead: Flash PMIs, UK and Japan CPIs in focus. RBNZ to hold rates

After cool US CPI, attention shifts to UK and Japanese inflation. Flash PMIs will be watched too amid signs of a rebound in Europe. Fed to stay in the spotlight as plethora of speakers, minutes on tap.