• AUD/JPY jumped from YTD lows of 87.12 and reclaimed 88.00 as sentiment turned upbeat.
  • AUD/JPY Price Analysis: To remain sideways within the 87.00/89.00 range.

AUD/JPY trimmed some of its earlier losses and finished Monday’s session with losses of 0.13%. However, as the Asian session begins, the AUD/JPY is up 0.09%, exchanging hands at 88.25 at the time of writing.

AUD/JPY Price action

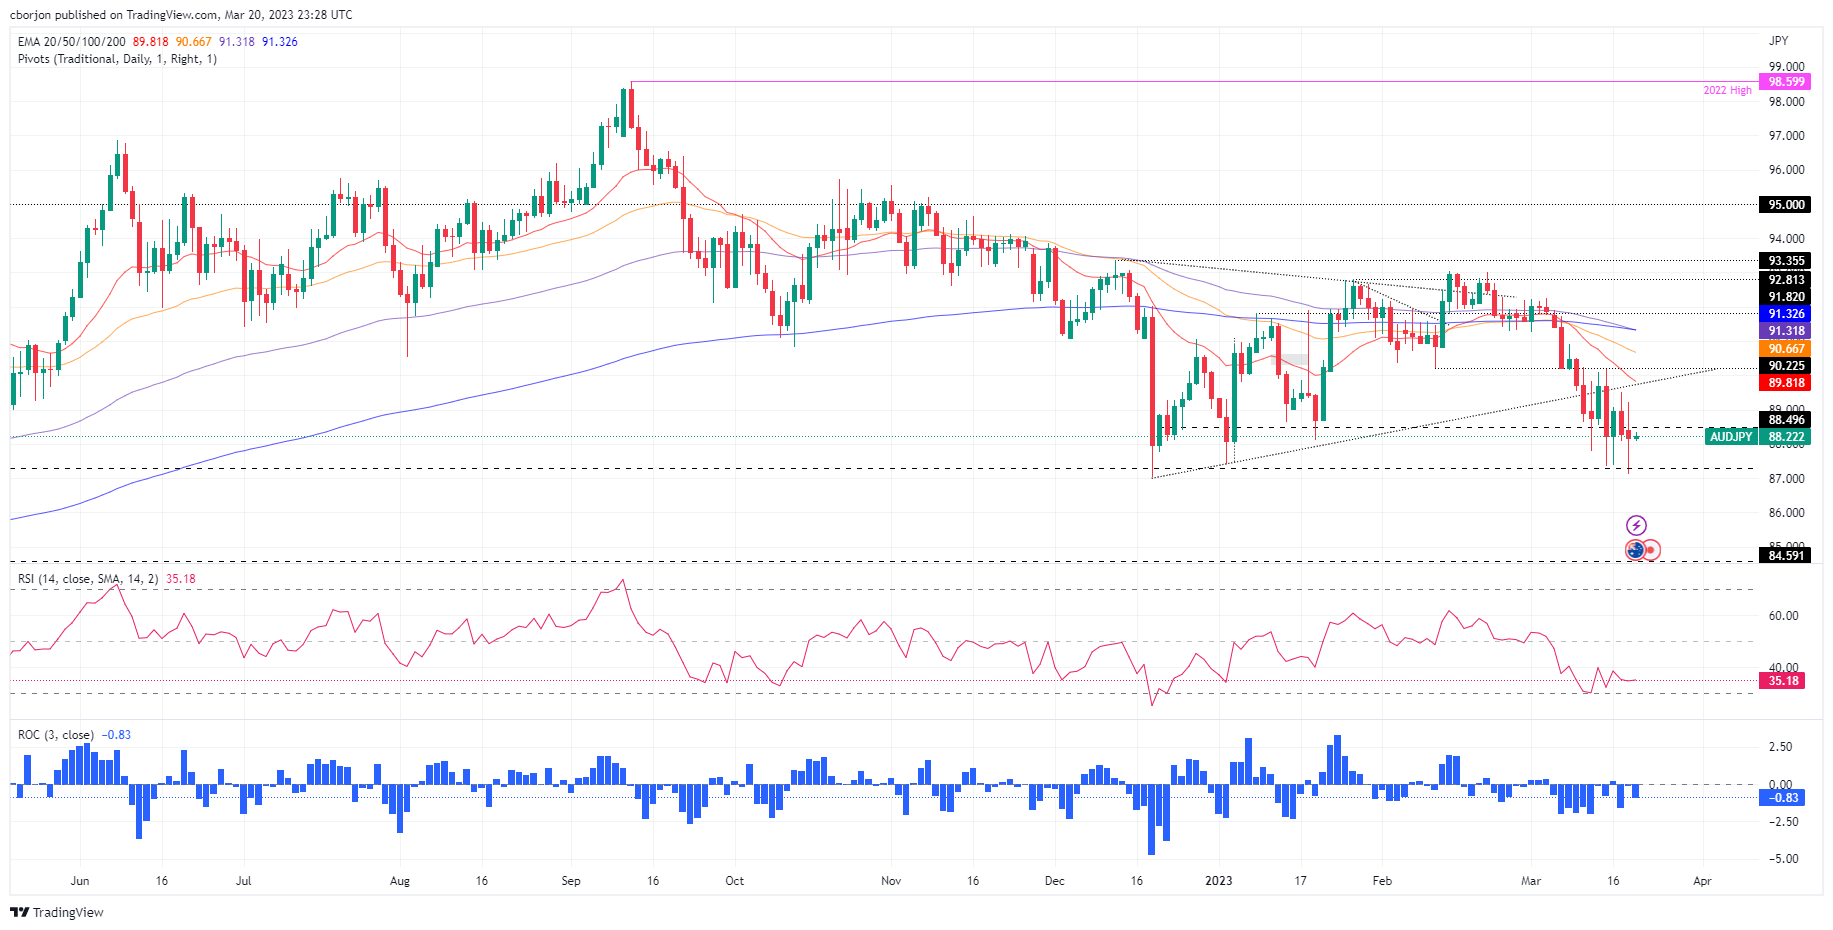
After falling to multi-week lows at 87.12, the AUD/JPY staged a late recovery and closed above the 88.00 figure, portraying a spinning top indicating neither buyers nor sellers are in control. Nevertheless, the AUD/JPY is consolidating around the 87.00-89.20 range, below the daily Exponential Moving Averages (EMAs), with a neutral to a bearish bias.

Oscillators remain bearish, but the Relative Strength Index (RSI) turned flat, suggesting that selling pressure is waning. Contrarily, the Rate of Change (RoC) portrays sellers are gathering momentum, but they need to bring the AUD/JPY below 88.00, so they could have a chance to drag prices lower.

Therefore, the AUD/JPY’s first support would be the 88.00 mark. Once cleared, the AUD/JPY could dive towards the daily low at 87.12 before stumbling toward the 86.00 mark, ahead of testing March 2022 lows at around 84.59.

Conversely, the AUD/JPY first resistance would be 89.00. Break above will expose the March 20 daily high at 89.23 before testing the 20-day EMA at 89.82. After that, the next supply zone would be the 90.00 figure, followed by the 50-day EMA at 90.66, ahead of 91.00.

AUD/JPY Daily chart

AUD/JPY Daily chart

AUD/JPY Technical levels

AUD/JPY

Overview
Today last price 88.26
Today Daily Change -0.09
Today Daily Change % -0.10
Today daily open 88.35
 
Trends
Daily SMA20 90.75
Daily SMA50 91.03
Daily SMA100 91.61
Daily SMA200 92.9
 
Levels
Previous Daily High 89.51
Previous Daily Low 88.08
Previous Weekly High 90.2
Previous Weekly Low 87.36
Previous Monthly High 93.06
Previous Monthly Low 90.24
Daily Fibonacci 38.2% 88.63
Daily Fibonacci 61.8% 88.97
Daily Pivot Point S1 87.79
Daily Pivot Point S2 87.22
Daily Pivot Point S3 86.36
Daily Pivot Point R1 89.21
Daily Pivot Point R2 90.07
Daily Pivot Point R3 90.64


Share: Feed news

Information on these pages contains forward-looking statements that involve risks and uncertainties. Markets and instruments profiled on this page are for informational purposes only and should not in any way come across as a recommendation to buy or sell in these assets. You should do your own thorough research before making any investment decisions. FXStreet does not in any way guarantee that this information is free from mistakes, errors, or material misstatements. It also does not guarantee that this information is of a timely nature. Investing in Open Markets involves a great deal of risk, including the loss of all or a portion of your investment, as well as emotional distress. All risks, losses and costs associated with investing, including total loss of principal, are your responsibility. The views and opinions expressed in this article are those of the authors and do not necessarily reflect the official policy or position of FXStreet nor its advertisers. The author will not be held responsible for information that is found at the end of links posted on this page.

If not otherwise explicitly mentioned in the body of the article, at the time of writing, the author has no position in any stock mentioned in this article and no business relationship with any company mentioned. The author has not received compensation for writing this article, other than from FXStreet.

FXStreet and the author do not provide personalized recommendations. The author makes no representations as to the accuracy, completeness, or suitability of this information. FXStreet and the author will not be liable for any errors, omissions or any losses, injuries or damages arising from this information and its display or use. Errors and omissions excepted.

The author and FXStreet are not registered investment advisors and nothing in this article is intended to be investment advice.

Recommended content


Recommended content

Editors’ Picks

EUR/USD alternates gains with losses near 1.0720 post-US PCE

EUR/USD alternates gains with losses near 1.0720 post-US PCE

The bullish tone in the Greenback motivates EUR/USD to maintain its daily range in the low 1.070s in the wake of firmer-than-estimated US inflation data measured by the PCE.

EUR/USD News

GBP/USD clings to gains just above 1.2500 on US PCE

GBP/USD clings to gains just above 1.2500 on US PCE

GBP/USD keeps its uptrend unchanged and navigates the area beyond 1.2500 the figure amidst slight gains in the US Dollar following the release of US inflation tracked by the PCE.

GBP/USD News

Gold keeps its daily gains near $2,350 following US inflation

Gold keeps its daily gains near $2,350 following US inflation

Gold prices maintain their constructive bias around $2,350 after US inflation data gauged by the PCE surpassed consensus in March and US yields trade with slight losses following recent peaks.

Gold News

Bitcoin Weekly Forecast: BTC’s next breakout could propel it to $80,000 Premium

Bitcoin Weekly Forecast: BTC’s next breakout could propel it to $80,000

Bitcoin’s recent price consolidation could be nearing its end as technical indicators and on-chain metrics suggest a potential upward breakout. However, this move would not be straightforward and could punish impatient investors. 

Read more

Week ahead – Hawkish risk as Fed and NFP on tap, Eurozone data eyed too

Week ahead – Hawkish risk as Fed and NFP on tap, Eurozone data eyed too

Fed meets on Wednesday as US inflation stays elevated. Will Friday’s jobs report bring relief or more angst for the markets? Eurozone flash GDP and CPI numbers in focus for the Euro.

Read more

Forex MAJORS

Cryptocurrencies

Signatures