AUD/JPY Price Analysis: Climbs despite a sour market sentiment, buyers' eye 88.00
- AUD/JPYretrats from daily highs, on risk-off impulse.
- AUD/JPY correction fails to shake bearish bias, resistance at 20-day EMA.
- AUD/JPY is on the rise as the 4-hour chart shows bullish momentum

AUD/JPY edges down as the Asian session begins, but Tuesday’s gains opened the door for further upside in the pair. However, the AUD/JPY is still downward pressured, but resistance at the 20-day Exponential Moving Average (EMA) at 88.77 could be challenged. At the time of writing, the AUD/JPY is trading at 87.70.
AUD/JPY Price action
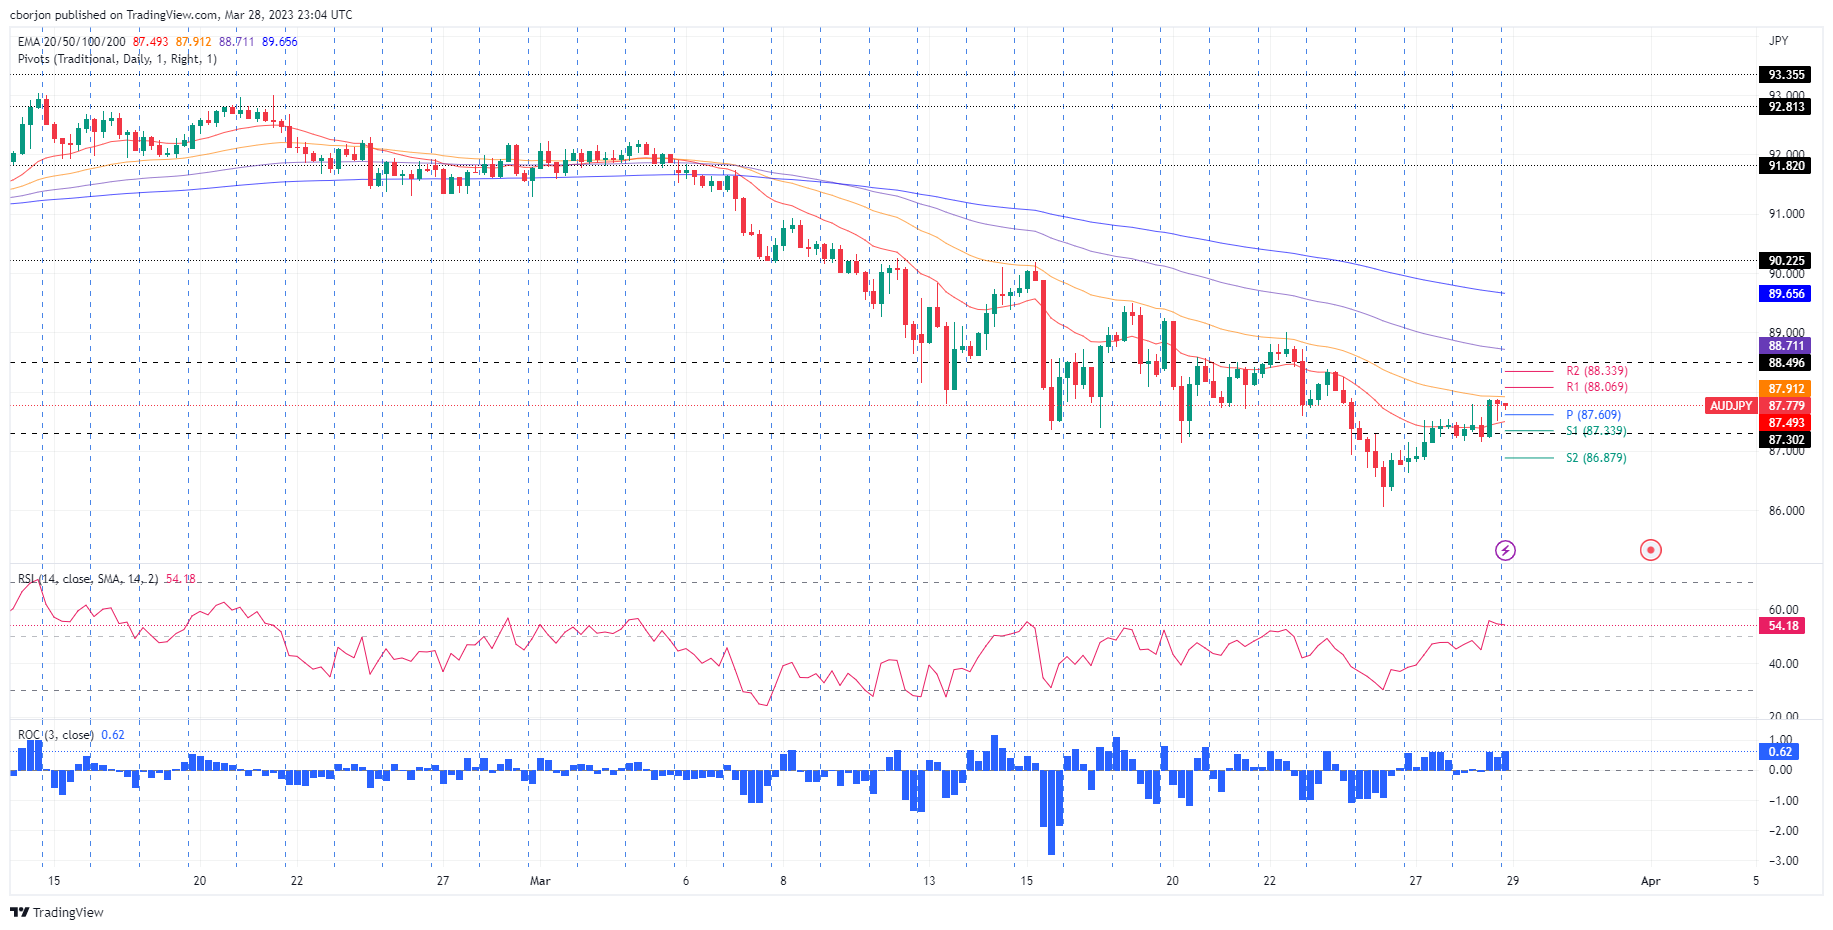
After printing back-to-back bullish candles, the AUD/JPY corrected upwards, yet a bearish bias remains. To change the pair’s preference to neutral, AUD/JPY buyers must conquer the 20-day EMA at 88.77 before reclaiming 89.00. Once achieved, the next resistance would be the 50-day EMA at 89.99, around 90.00. Conversely, the AUD/JPY would continue its downtrend if the pair stumbles below the March 28 low of 87.15, which could open the door for further losses.
In the near term, the AUD/JPY 4-hour chart portrays the pair’s testing of the 50-EMA at 87.91. The Relative Strength Index (RSI) in bullish territory favors upside price action, the same as the Rate of Change (RoC). Therefore, the AUD/JPY path of least resistance is upwards.
The AUD/JPY first resistance would be the confluence of the R1 pivot and the 88.00 figure. A breach of the latter will expose the R2 pivot at 88.34 before testing the 100-EMA at 88.71. On the flip side, the AUD/JPY first support would be the daily pivot at 87.61, followed by the 20-EMA At 87.49, ahead of testing the S1 pivot at 87.34.
AUD/JPY 4-hour chart chart
AUD/JPY Technical levels
Author

Christian Borjon Valencia
FXStreet
Markets analyst, news editor, and trading instructor with over 14 years of experience across FX, commodities, US equity indices, and global macro markets.


