AUD/JPY Price Analysis: Bulls recover traction, recovery may be incoming


  • The selling pressure dominates the daily chart, but indicators recovered on Tuesday.
  • The hourly chart also depicts an improvement hinting at a potential recovery.
  • With the operating above key SMAs, a longer-term bullish sentiment could potentially override recent bearish tendencies.

The AUD/JPY pair is trading at 97.477, showing a gain of 0.31%. Despite the gains, selling pressure seems to dominate in the short term but the overall trend remains bullish. Indicators are improving in the hourly chart.

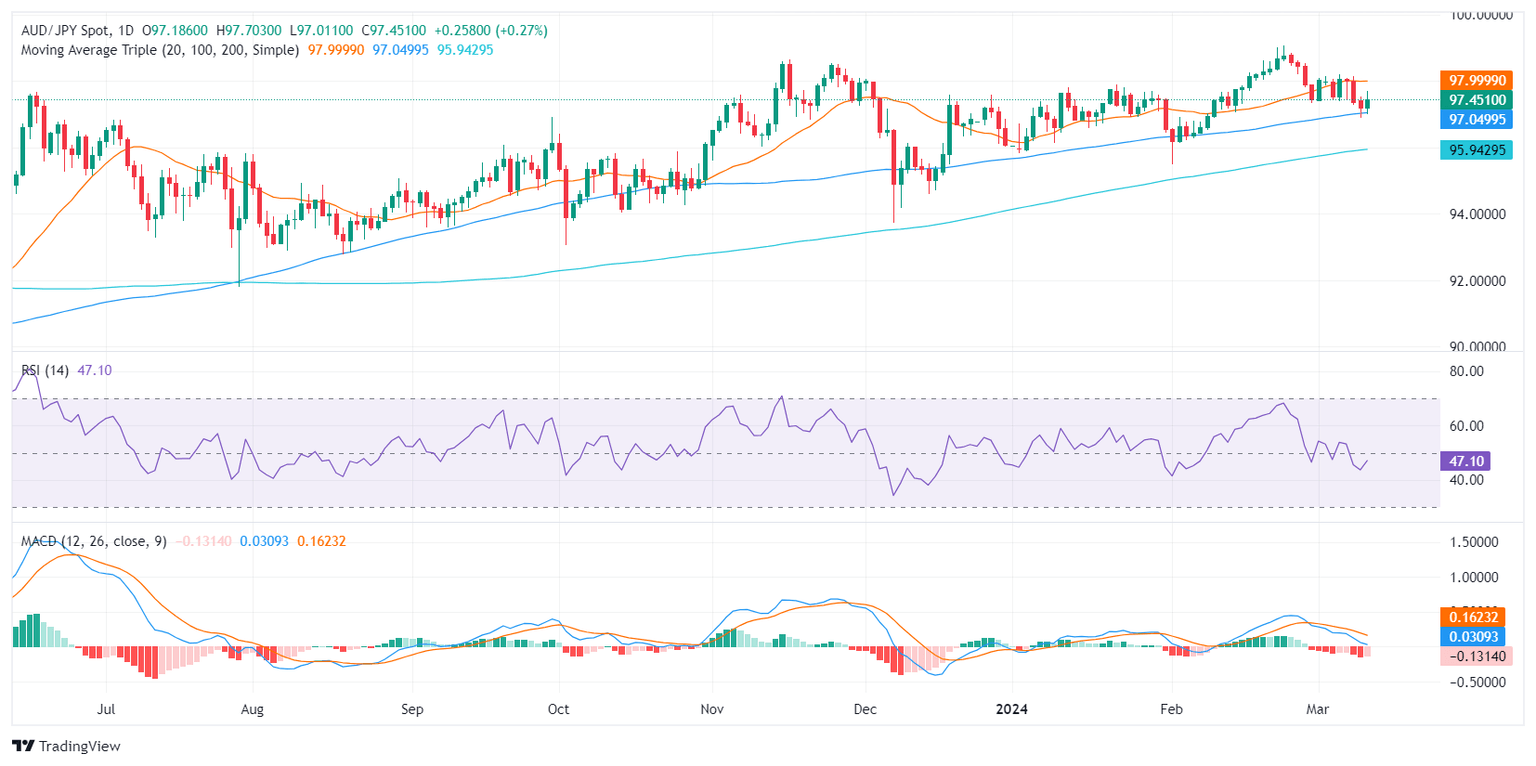
Based on the indicators of the daily chart, the AUD/JPY pair shows a negative momentum as the Relative Strength Index (RSI) is currently in negative territory. Its rising slope however, suggests that the buyers are recovering The declining red bars in the Moving Average Convergence Divergence (MACD) histogram further emphasize this bearish momentum, signaling that sellers currently dominate the market but with a weakened grip.

AUD/JPY daily chart

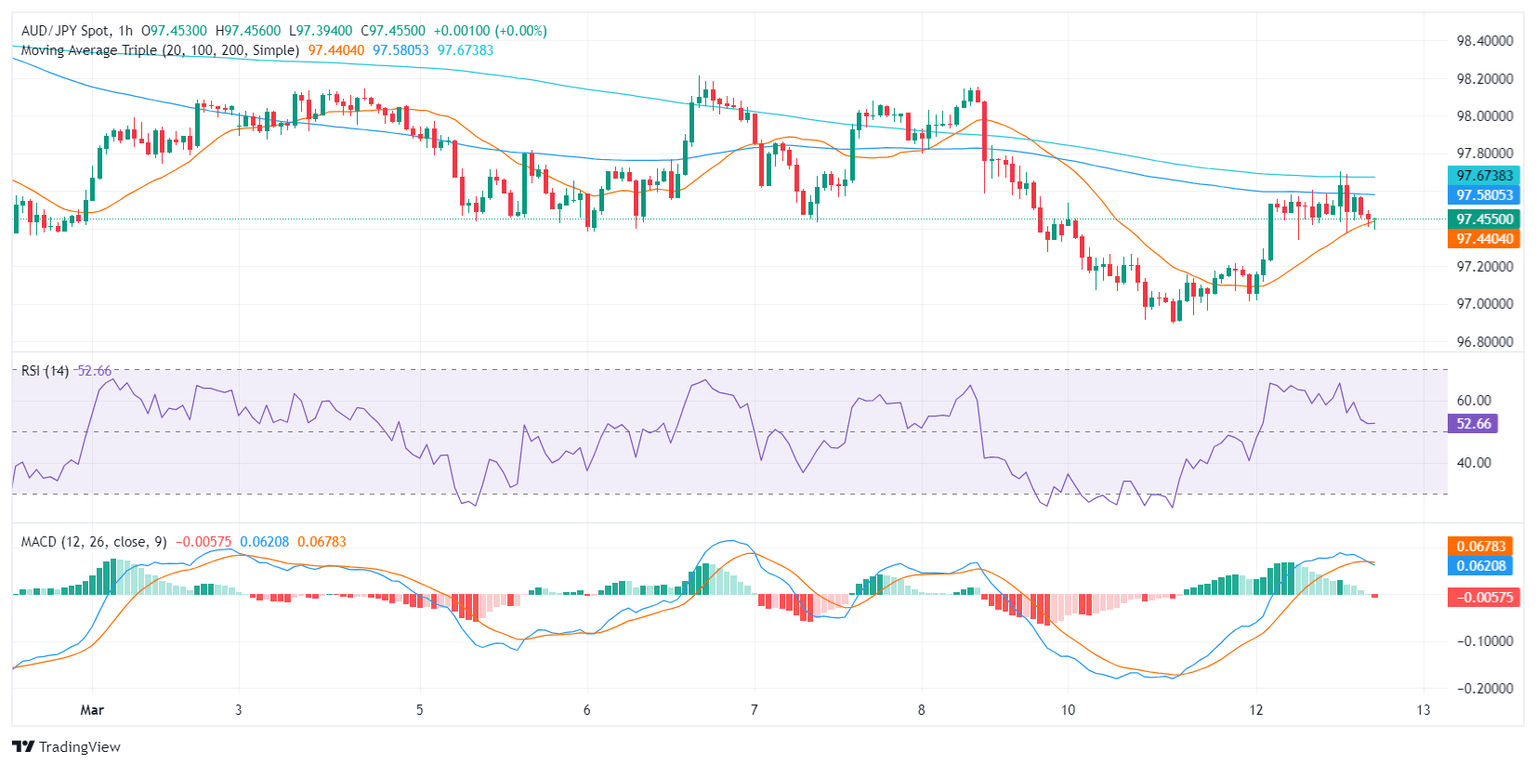
Transitioning to the hourly chart, the RSI stands in positive territory, illustrating a recovery in recent hours. The MACD histogram on the other hand printed a red bar, indicating that the resurge might be short-lived.

AUD/JPY hourly chart

Looking at the broader context, despite the short-term negative outlook, the AUD/JPY remains bullish as it trades above its 100, and 200-day Simple Moving Averages (SMAs). This suggests that the longer-term positive trend could still overshadow recent bearish movements. That being said, the buyers shouldn’t relax and must recover the 20-day average to resume its upward path.

AUD/JPY

Overview
Today last price 97.52
Today Daily Change 0.33
Today Daily Change % 0.34
Today daily open 97.19
 
Trends
Daily SMA20 97.99
Daily SMA50 97.4
Daily SMA100 97.03
Daily SMA200 95.92
 
Levels
Previous Daily High 97.54
Previous Daily Low 96.9
Previous Weekly High 98.22
Previous Weekly Low 97.28
Previous Monthly High 99.06
Previous Monthly Low 95.5
Daily Fibonacci 38.2% 97.14
Daily Fibonacci 61.8% 97.29
Daily Pivot Point S1 96.88
Daily Pivot Point S2 96.57
Daily Pivot Point S3 96.24
Daily Pivot Point R1 97.52
Daily Pivot Point R2 97.85
Daily Pivot Point R3 98.16


Share: Feed news

Information on these pages contains forward-looking statements that involve risks and uncertainties. Markets and instruments profiled on this page are for informational purposes only and should not in any way come across as a recommendation to buy or sell in these assets. You should do your own thorough research before making any investment decisions. FXStreet does not in any way guarantee that this information is free from mistakes, errors, or material misstatements. It also does not guarantee that this information is of a timely nature. Investing in Open Markets involves a great deal of risk, including the loss of all or a portion of your investment, as well as emotional distress. All risks, losses and costs associated with investing, including total loss of principal, are your responsibility. The views and opinions expressed in this article are those of the authors and do not necessarily reflect the official policy or position of FXStreet nor its advertisers. The author will not be held responsible for information that is found at the end of links posted on this page.

If not otherwise explicitly mentioned in the body of the article, at the time of writing, the author has no position in any stock mentioned in this article and no business relationship with any company mentioned. The author has not received compensation for writing this article, other than from FXStreet.

FXStreet and the author do not provide personalized recommendations. The author makes no representations as to the accuracy, completeness, or suitability of this information. FXStreet and the author will not be liable for any errors, omissions or any losses, injuries or damages arising from this information and its display or use. Errors and omissions excepted.

The author and FXStreet are not registered investment advisors and nothing in this article is intended to be investment advice.

Recommended content


Recommended content

Editors’ Picks

EUR/USD clings to gains above 1.0750 after US data

EUR/USD clings to gains above 1.0750 after US data

EUR/USD manages to hold in positive territory above 1.0750 despite retreating from the fresh multi-week high it set above 1.0800 earlier in the day. The US Dollar struggles to find demand following the weaker-than-expected NFP data.

EUR/USD News

GBP/USD declines below 1.2550 following NFP-inspired upsurge

GBP/USD declines below 1.2550 following NFP-inspired upsurge

GBP/USD struggles to preserve its bullish momentum and trades below 1.2550 in the American session. Earlier in the day, the disappointing April jobs report from the US triggered a USD selloff and allowed the pair to reach multi-week highs above 1.2600.

GBP/USD News

Gold struggles to hold above $2,300 despite falling US yields

Gold struggles to hold above $2,300 despite falling US yields

Gold stays on the back foot below $2,300 in the American session on Friday. The benchmark 10-year US Treasury bond yield stays in negative territory below 4.6% after weak US data but the improving risk mood doesn't allow XAU/USD to gain traction.

Gold News

Bitcoin Weekly Forecast: Should you buy BTC here? Premium

Bitcoin Weekly Forecast: Should you buy BTC here?

Bitcoin (BTC) price shows signs of a potential reversal but lacks confirmation, which has divided the investor community into two – those who are buying the dips and those who are expecting a further correction.

Read more

Week ahead – BoE and RBA decisions headline a calm week

Week ahead – BoE and RBA decisions headline a calm week

Bank of England meets on Thursday, unlikely to signal rate cuts. Reserve Bank of Australia could maintain a higher-for-longer stance. Elsewhere, Bank of Japan releases summary of opinions.

Read more

Forex MAJORS

Cryptocurrencies

Signatures