|

AUD/JPY Price Analysis: Aussie soars, buyers start to back off on the hourly chart

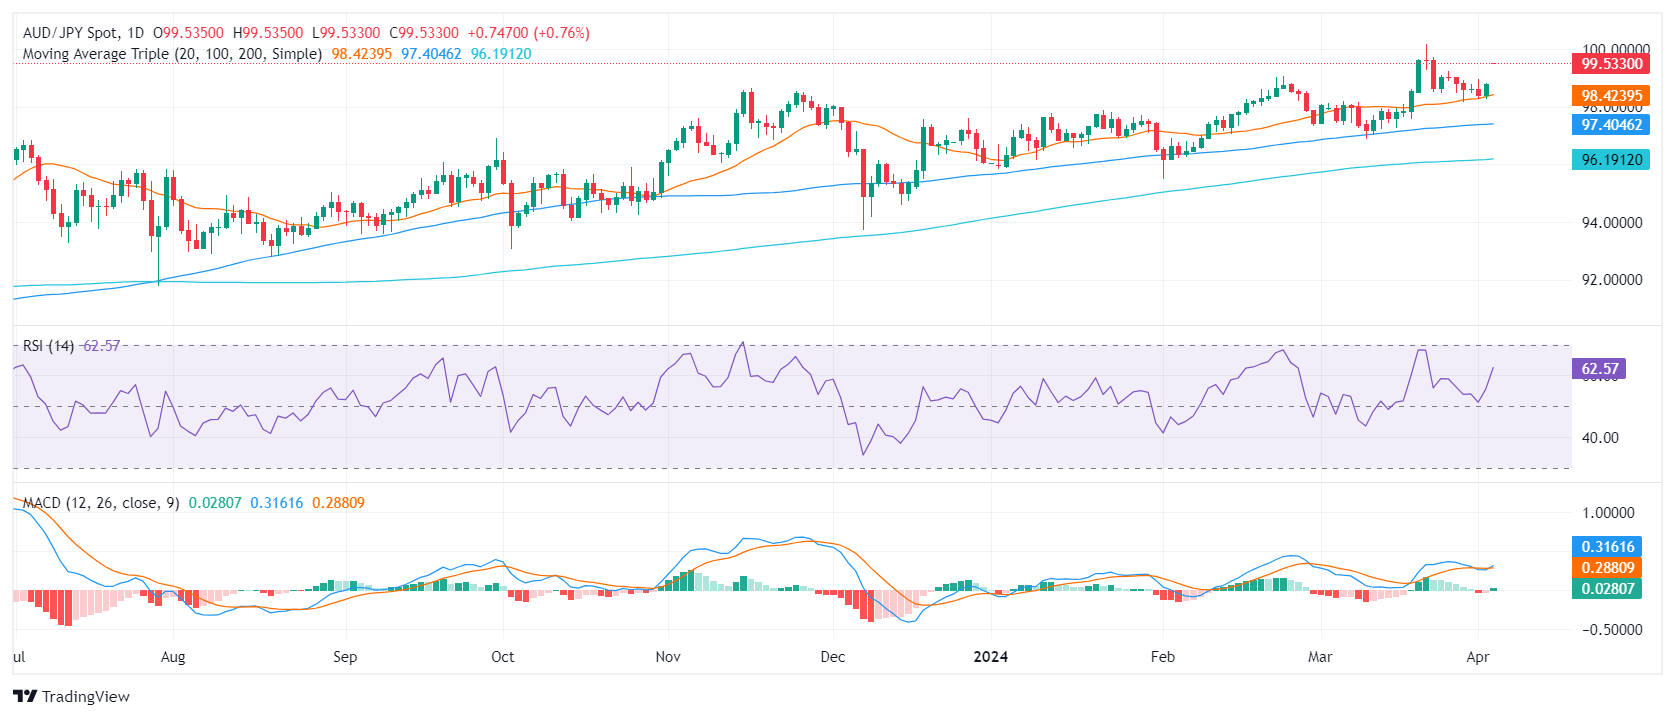
  • The daily chart presents a strong buying momentum with indicators deep in positive territory.
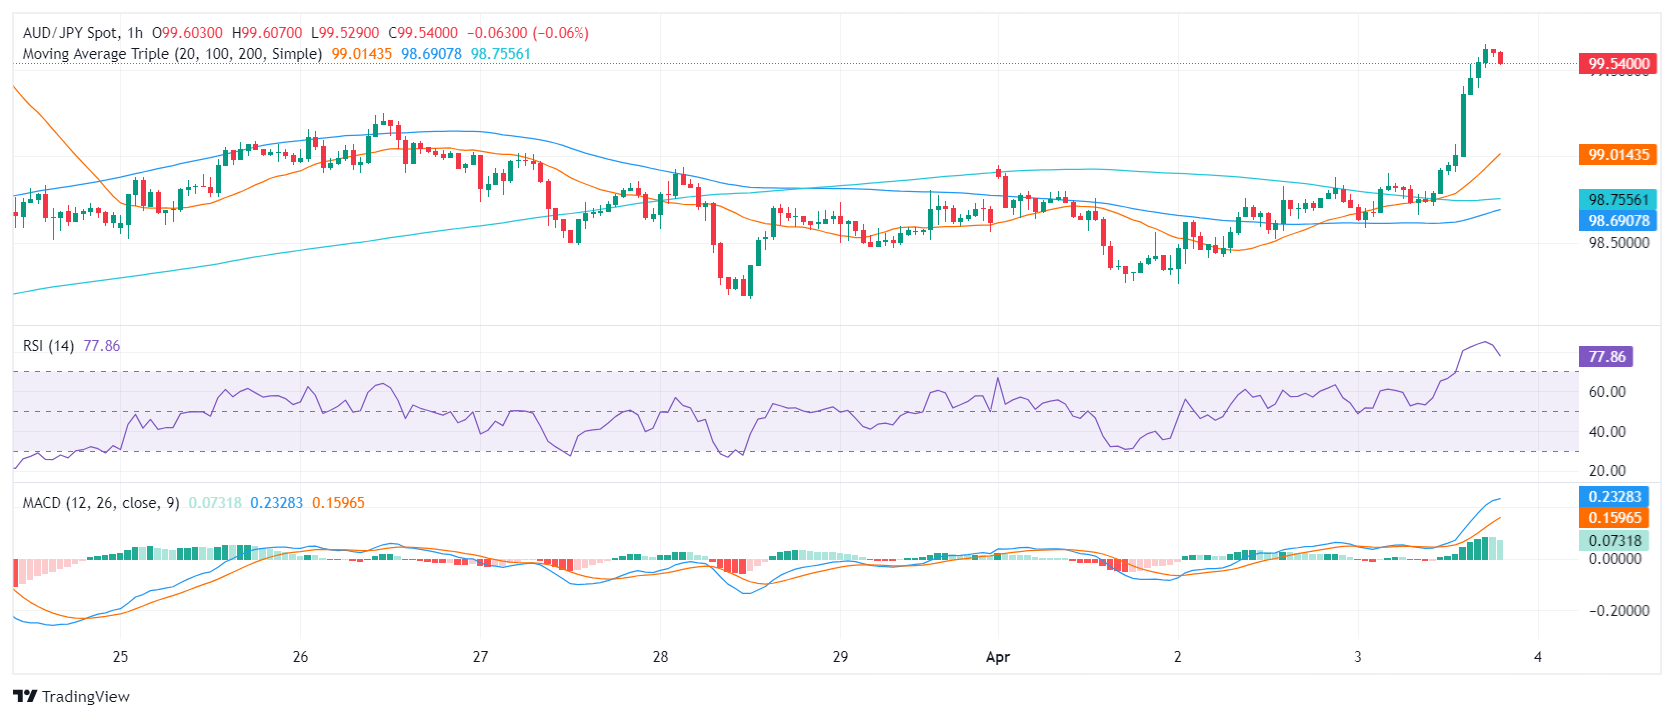
  • On the hourly chart, the RSI resides in the overbought zone, suggesting a short-term consolidation of the recent gains.

In Wednesday's session, the AUD/JPY pair is trading at 99.58, following an increase of 0.82%. Buyers appear in control, but indicators are flashing signals of a short-term consolidation.

On the daily chart, the AUD/JPY pair reveals a bullish sentiment. The Relative Strength Index (RSI) resides deep in positive territory, with recent readings reaching as high as 61, indicating the domination of buyers in the market. Furthermore, the rising green bars on the Moving Average Convergence Divergence (MACD) histogram show a positive momentum, supporting the bullish outlook.

AUD/JPY daily chart

Upon inspecting the hourly chart, the RSI readings consistently hover in the overbought zone, with the latest entry at 78 but the index has started to edge downwards. A flat green histogram on the MACD also gives arguments for a short-term consolidation.

AUD/JPY hourly chart

Considering the broader outlook, the pair also stands above the 20,100 and 200-day Simple Moving Averages (SMAs). This setup suggests short-term and long-term trends are bullish, and traders may expect further upside.

In conclusion, both daily and hourly charts for the AUD/JPY pair highlight a bullish outlook. The RSI values and the MACD histograms across both timelines point to strong upward movement, with buyers currently holding market reins. However, indicators on the hourly chart point to further consolidation as they lie deep in the overbought zone.

AUD/JPY

Overview
Today last price99.53
Today Daily Change0.74
Today Daily Change %0.75
Today daily open98.79
 
Trends
Daily SMA2098.35
Daily SMA5097.87
Daily SMA10097.39
Daily SMA20096.17
 
Levels
Previous Daily High98.83
Previous Daily Low98.26
Previous Weekly High99.25
Previous Weekly Low98.18
Previous Monthly High100.17
Previous Monthly Low96.9
Daily Fibonacci 38.2%98.61
Daily Fibonacci 61.8%98.48
Daily Pivot Point S198.42
Daily Pivot Point S298.06
Daily Pivot Point S397.86
Daily Pivot Point R198.99
Daily Pivot Point R299.19
Daily Pivot Point R399.55

Author

Patricio Martín

Patricio is an economist from Argentina passionate about global finance and understanding the daily movements of the markets.

More from Patricio Martín
Share:

Markets move fast. We move first.

Orange Juice Newsletter brings you expert driven insights - not headlines. Every day on your inbox.

By subscribing you agree to our Terms and conditions.

Editor's Picks

EUR/USD rebounds after falling toward 1.1700

EUR/USD gains traction and trades above 1.1730 in the American session, looking to end the week virtually unchanged. The bullish opening in Wall Street makes it difficult for the US Dollar to preserve its recovery momentum and helps the pair rebound heading into the weekend.

GBP/USD steadies below 1.3400 as traders assess BoE policy outlook

Following Thursday's volatile session, GBP/USD moves sideways below 1.3400 on Friday. Investors reassess the Bank of England's policy oıtlook after the MPC decided to cut the interest rate by 25 bps by a slim margin. Meanwhile, the improving risk mood helps the pair hold its ground.

Gold stays below $4,350, looks to post small weekly gains

Gold struggles to gather recovery momentum and stays below $4,350 in the second half of the day on Friday, as the benchmark 10-year US Treasury bond yield edges higher. Nevertheless, the precious metal remains on track to end the week with modest gains as markets gear up for the holiday season.

Crypto Today: Bitcoin, Ethereum, XRP rebound amid bearish market conditions

Bitcoin (BTC) is edging higher, trading above $88,000 at the time of writing on Monday. Altcoins, including Ethereum (ETH) and Ripple (XRP), are following in BTC’s footsteps, experiencing relief rebounds following a volatile week.

How much can one month of soft inflation change the Fed’s mind?

One month of softer inflation data is rarely enough to shift Federal Reserve policy on its own, but in a market highly sensitive to every data point, even a single reading can reshape expectations. November’s inflation report offered a welcome sign of cooling price pressures. 

XRP rebounds amid ETF inflows and declining retail demand demand

XRP rebounds as bulls target a short-term breakout above $2.00 on Friday. XRP ETFs record the highest inflow since December 8, signaling growing institutional appetite.