Apple Inc.(AAPL) Elliott Wave technical analysis [Video]
![Apple Inc.(AAPL) Elliott Wave technical analysis [Video]](https://editorial.fxstreet.com/images/Psychology/human-finger-is-pushing-easy-button-on-computer-keyboard-gm474938486-64986161_XtraLarge.jpg)
AAPL Elliott Wave Analysis Trading Lounge Daily Chart, 5 March 24.
Apple Inc., (AAPL) Daily Chart.
AAPL Elliott Wave technical analysis
Function: Counter Trend.
Mode: Corrective.
Structure: Flat.
Position: Minute {c} of wave 2.
Direction: Completion of wave {c} of 2.
Details: Today we are looking at two different count on the daily and 4H chart. On the daily I am exploring the possibility of a wave {c} in the making, headed towards the lower end of MG2 at 165$, to then start finding support.
AAPL Elliott Wave technical analysis – Daily chart
Our analysis reveals a counter trend function with a corrective mode, characterized by a flat structure. Positioned in Minute {c} of wave 2, we anticipate the completion of wave {c} of 2. Today, we're exploring two different counts on both the daily and 4Hr charts.

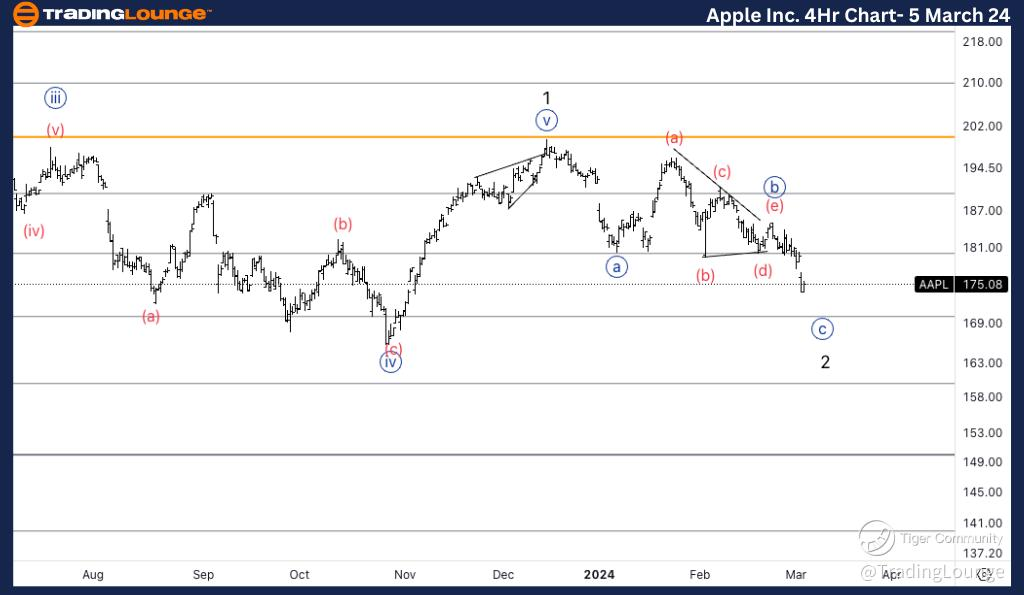
AAPL Elliott Wave Analysis Trading Lounge 4Hr Chart, 5 March 24.
Apple Inc., (AAPL) 4Hr Chart
AAPL Elliott Wave technical analysis
Function: Counter Trend.
Mode: Corrective.
Structure: Flat.
Position: Wave {c} of 2.
Direction: Acceleration higher into wave (iii) of {c}.
Details: Here we have a top in wave 1 where we previously had a wave {b} top. Looking for similar downside targets towards 165$.
Welcome to our AAPL Elliott Wave Analysis Trading Lounge, your hub for comprehensive insights into Apple Inc. (AAPL) using Elliott Wave Technical Analysis. Let's delve into the market dynamics as of the Daily Chart on 5th March 2024.
AAPL Elliott Wave technical analysis – Four hour chart
Here, we maintain a counter trend function with a corrective mode, identified by a flat structure. Positioned in Wave {c} of 2, we anticipate acceleration higher into wave (iii) of {c}. This analysis follows a previous top in wave 1, where we observed a wave {b} top. We anticipate similar downside targets toward $165.
AAPL Elliott Wave technical analysis [Video]
Author

Peter Mathers
TradingLounge
Peter Mathers started actively trading in 1982. He began his career at Hoei and Shoin, a Japanese futures trading company.


