Why use Financial Astrology to trade FX?

Looking for potential Market Turns in FX markets?
Many traders had come to me saying that the FX market is so unpredictable and that not only does the release of economic data move the currencies’ prices, the FX market seems to be affected by many other factors like central banks’ speeches and their intentions of raising or reducing its currency interest rates. And yet, putting aside all these news-related price movements, the currencies also seems to have a kind of rhythm to dance with themselves.
Yes, FX markets do response to a lot to expected news (such as economic data release) and unexpected news (such as earthquakes/ missile tests from Korea etc) as it pretty much runs 24 hours a day. But this is also the reason why I like to trade with FX a lot – that is, the planets in our solar system are also moving in the sky 24 hours a day as well. And they keep on giving signals to our investment markets – Don’t understand what I mean? Let’s see a few examples on how I read the markets from an astrological point of view!
How to trade with the Astrology Timing
Spot for set ups
- Mid to Long Term
First, I would like to raise a non-FX example so as to explain the theory that I am introducing to you is universal to all investment products, and that it does not only confine within the FX market.
For example, on 2010-May-28 is the Uranus ingress date, and let us take a look on its interaction with the Dow Jones Industrial Index. (Shock!) See that Uranus ingress served as a ‘base’ for market to advance as time goes by.
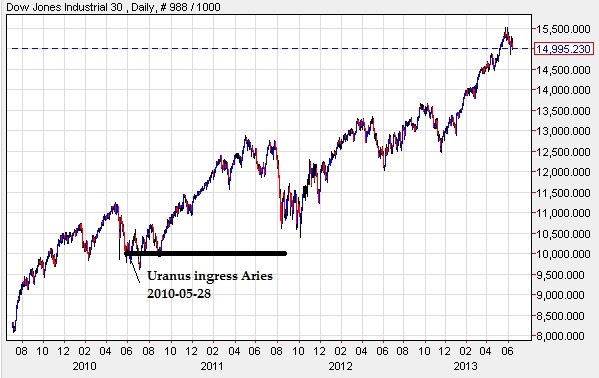
The good news is: this price pattern is not a single-time incident, and now, all of a sudden, the market becomes predictable. Let us now trace back one earlier ingress date of Uranus –
This is what had happened when Uranus ingressed Pisces on 2003 March 11.
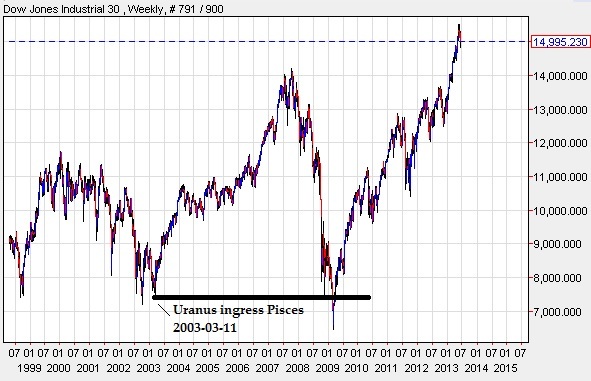
It (ingress of Pisces) served as a ‘base’ for the bull market in 2003 – 2007, and it worked nicely with the 2008/ 2009 financial crisis which it served as a mysterious support at the same price level.
Do you see same interaction/ price pattern going on, in both of the DJI charts?
How “Eph Alarm” will able to help you
Assuming you have already downloaded the iOS app “Eph Alarm” and have watched the video which introduces basic functions of the app on "Trineaspect".
Now you can import all these ingresses date onto your apple calendar, and set an alarm from 120minutes to 3 days ‘after’ they occurred in the sky and check if they had served as ‘ bases’ in the market when the alarm reminds you of their occurrence.
Set a tight stop loss a bit below (if it serves as a bottom) or above (if it serve as a top) the ‘base’, and then you can ride with the trend together with your analysis derived from fundamental analysis or technical indicators.
You can also treat the ‘base’ as an alert that a certain trend might have changed whenever the market breaks these ingress ‘bases’!
How to import the ingress dates onto the calendar
Below are the screen shot from the app, Just click on the solar button on the Top left corner and choose Set Alarm
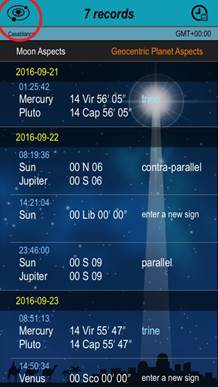
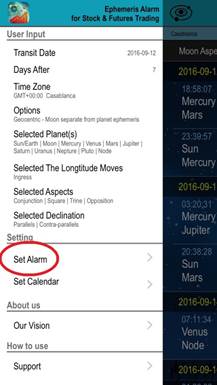
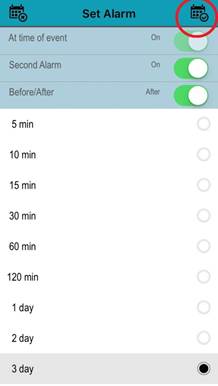
And clicking the right top hand Calendar button will allow you to import all these astro phenomena dates into your apple calendar.
- Short Term & Intraday Trade
The same theory actually also applies to other faster moving planets like mercury. And now let us do another example here:
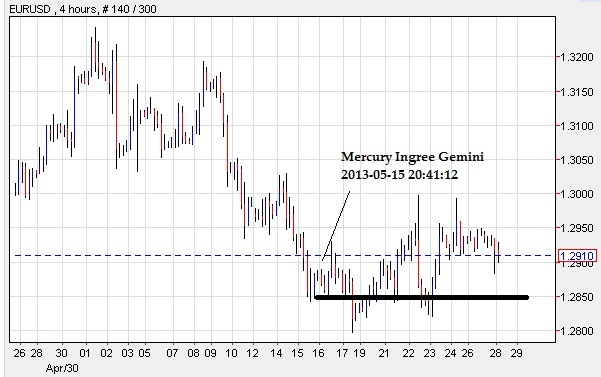
You may see when Mercury ingress Gemini, it serves another nice bottom for the Euro in May, 2013.
And for intraday traders, I personally use moon ingresses to trade with a tight stop loss around 25 pips on volatile market like JPY/ EUR/ GBP. I have traded on this strategy around 2 years now and so far it works ok
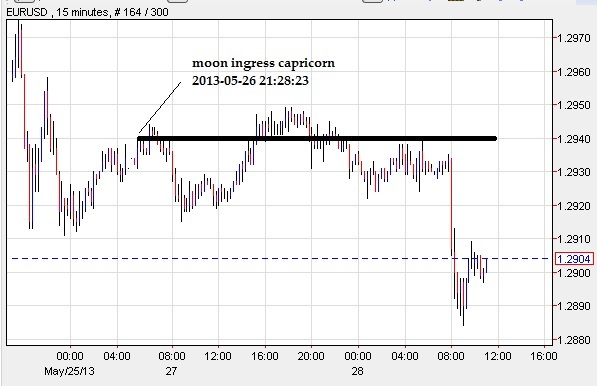
As you can see, the market usually stay near the ingress point and not moving exceed more than 25pips. and then *boom!*, and this chart showed I can easily get the 50 pips profit with little drawdown in my position. Risk Reward Ratio is 1:2.0+
Author

Khit Wong
Gann Explained
As a noted expert on FXStreet.com and in “Technical Analysis of Stocks & Commodities” and "Traders World," I specialize in applying W.D. Gann's complex theories to practical trading.


