![]() Elliott Wave Forecast Team
Elliott Wave Forecast Team
ElliottWave-Forecast.com
In Elliott Wave, there are several different corrective structures. Two of the most common corrective structures are zigzag ABC and double three WXY. A zigzag is a simple correction that all wavers is familiar with. The subdivision of ABC is 5-3-5, as the graph below illustrates.
ABC Zigzag Structure
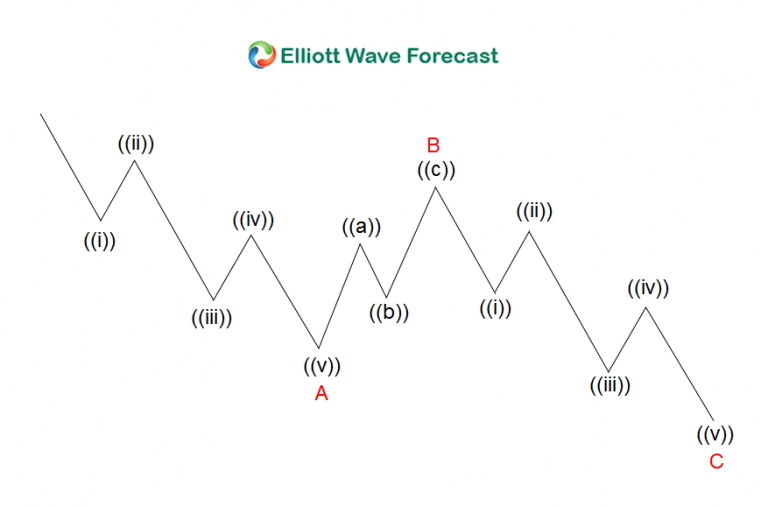
The concept in Elliott Wave is simple. The main thesis is that trend moves in 5 waves called an impulse, while counter-trend moves in 3 waves. Thus in a bullish market, traders want to trade in the direction of the trend to the upside by buying a counter-trend pullback. To buy a pullback, traders need to wait for a clear 3 waves pullback such as a zigzag ABC above. In a typical ABC correction, wave C tends to end somewhere around 100% –" 161.8% Fibonacci extension of wave A. Wave C should not extend more than 161.8% relative to wave A otherwise the entire decline can become a 5 waves.
The reason is because wave 3 in an impulse is usually the strongest and the longest wave. In Fibonacci terms, wave 3 tends to be at least 161.8% extension of wave 1. Since the subdivision of wave 1 and wave 3 in an impulse is also in 5 waves, we do not know ahead of time if the decline will be ABC or 123. Traders can identify whether the decline is a beginning of a 5 waves impulse or an ABC is by looking at the third swing extension. If the third swing extends only to 100% of the first swing, then it’s an ABC zigzag. If the third swing extends to at least 161.8% of the first swing, then the odd increases that we are in an impulsive structure.
Traders who want to buy an ABC counter-trend move therefore can limit the risk at the 161.8% extension because below there, the entire decline can become impulsive and trend direction could change. Thus, traders who trade ABC pattern always have the risk that they are actually trying to buy a wave 3.
WXY Double Three Structure
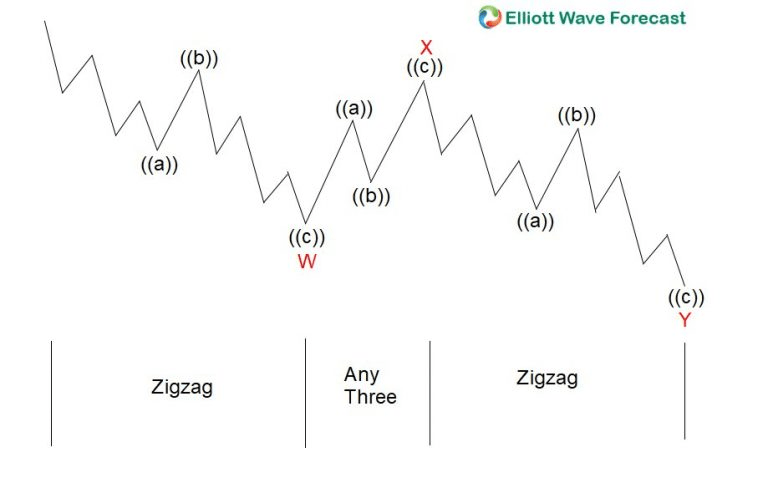
Another type of corrective structure is a double three WXY, as the graph above illustrates. This is a complex correction involving two types of corrective structures. In the graph above, the first leg wave W and third leg wave Y are both zigzag. We can call this specific pattern a double zigzag. We can consider WXY as a 3-3-3 pattern. The first (W), second (X), and third leg (Y) all subdivide in 3 waves ((a))-((b))-((c)). In the simplest term, these are two zigzag corrections linked together in WXY. Despite the complex subdivision , this is essentially also a 3 swing correction labelled as WXY if we just focus on the main degree and not the subdivision.
Similar to ABC, wave Y also usually ends at 100% –" 161.8% Fibonacci extension relative to wave W. The third swing wave Y should not go below 161.8% extension of the first swing wave W. Otherwise, it increases the odd of further downside. A trader who wants to buy a corrective pattern WXY thus can try to buy wave Y at the 100% of wave W with stop loss below 161.8%. There is however a major difference in buying a WXY correction compared to ABC. In a WXY pattern, the first leg wave W already shows a clear 3 waves subdivision.
Thus, it has confirmed the structure to be corrective. In ABC pattern however, the first leg wave A is in 5 waves. If traders buy wave C at 100% of wave A, they run the risk that wave C can become a wave 3. If traders buy wave Y at 100% of wave W however, the chance that it will become wave 3 and breaks below 161.8% extension is smaller because the first leg wave W in this case subdivides in 3 waves. In an impulse, the first swing wave 1 must subdivide in 5 waves, similar to wave A in a zigzag. Thus, if wave W is in clear 3 waves, it reduces the risk that the decline becomes an impulse.
In summary, WXY is a better corrective pattern to trade than ABC. The pattern reduces the risk that the correction will become an impulse which is something that traders want to avoid.
FURTHER DISCLOSURES AND DISCLAIMER CONCERNING RISK, RESPONSIBILITY AND LIABILITY Trading in the Foreign Exchange market is a challenging opportunity where above average returns are available for educated and experienced investors who are willing to take above average risk. However, before deciding to participate in Foreign Exchange (FX) trading, you should carefully consider your investment objectives, level of xperience and risk appetite. Do not invest or trade capital you cannot afford to lose. EME PROCESSING AND CONSULTING, LLC, THEIR REPRESENTATIVES, AND ANYONE WORKING FOR OR WITHIN WWW.ELLIOTTWAVE- FORECAST.COM is not responsible for any loss from any form of distributed advice, signal, analysis, or content. Again, we fully DISCLOSE to the Subscriber base that the Service as a whole, the individual Parties, Representatives, or owners shall not be liable to any and all Subscribers for any losses or damages as a result of any action taken by the Subscriber from any trade idea or signal posted on the website(s) distributed through any form of social-media, email, the website, and/or any other electronic, written, verbal, or future form of communication . All analysis, trading signals, trading recommendations, all charts, communicated interpretations of the wave counts, and all content from any media form produced by www.Elliottwave-forecast.com and/or the Representatives are solely the opinions and best efforts of the respective author(s). In general Forex instruments are highly leveraged, and traders can lose some or all of their initial margin funds. All content provided by www.Elliottwave-forecast.com is expressed in good faith and is intended to help Subscribers succeed in the marketplace, but it is never guaranteed. There is no “holy grail” to trading or forecasting the market and we are wrong sometimes like everyone else. Please understand and accept the risk involved when making any trading and/or investment decision. UNDERSTAND that all the content we provide is protected through copyright of EME PROCESSING AND CONSULTING, LLC. It is illegal to disseminate in any form of communication any part or all of our proprietary information without specific authorization. UNDERSTAND that you also agree to not allow persons that are not PAID SUBSCRIBERS to view any of the content not released publicly. IF YOU ARE FOUND TO BE IN VIOLATION OF THESE RESTRICTIONS you or your firm (as the Subscriber) will be charged fully with no discount for one year subscription to our Premium Plus Plan at $1,799.88 for EACH person or firm who received any of our content illegally through the respected intermediary’s (Subscriber in violation of terms) channel(s) of communication.
Editors’ Picks

EUR/USD clings to daily gains, still below 1.1900
EUR/USD manages to reverse two daily pullbacks in a row and advances modestly on Thursday, hovering around the 1.1880 zone amid the inconclusive price action around the US Dollar. Meanwhile, weekly Initial Claims rose more than expected last week, while attention is expected to shift to the upcoming US CPI data on Friday.

GBP/USD picks up pace, hits 1.3640
GBP/USD trades with modest gains around 1.3640 so far on Thursday. Indeed, Cable looks to leave behind the weakness seen in the first half of the week in a context of an equally erratic performance in the Greenback and disappoting UK data releases.

USD/JPY consolidates around 153.00 favoured by lower Fed easing bets
USD/JPY steadies around 153.00 after hitting two-week lows at 152.25. A strong US Nonfarm Payrolls report provided some support for the US Dollar on Wednesday. The Yen remains on track for a 2.6% weekly rally, boosted by Takaichi's victory at Sunday's elections.
Editors’ Picks
EUR/USD clings to daily gains, still below 1.1900
EUR/USD manages to reverse two daily pullbacks in a row and advances modestly on Thursday, hovering around the 1.1880 zone amid the inconclusive price action around the US Dollar. Meanwhile, weekly Initial Claims rose more than expected last week, while attention is expected to shift to the upcoming US CPI data on Friday.
GBP/USD picks up pace, hits 1.3640
GBP/USD trades with modest gains around 1.3640 so far on Thursday. Indeed, Cable looks to leave behind the weakness seen in the first half of the week in a context of an equally erratic performance in the Greenback and disappoting UK data releases.

Gold stays offered below $5,100
Gold keeps the choppy trade well in place on Thursday, navigating the area below the $5,100 mark per troy ounce amid the lack of clear direction in the Greenback, declining US Treasury yields across the curve and caution ahead of Friday’s publication of US CPI.

LayerZero Price Forecast: ZRO steadies as markets digest Zero blockchain announcement
LayerZero (ZRO) trades above $2.00 at press time on Thursday, holding steady after a 17% rebound the previous day, which aligned with the public announcement of the Zero blockchain and Cathie Wood joining the advisory board.

A tale of two labour markets: Headline strength masks underlying weakness
Undoubtedly, yesterday’s delayed US January jobs report delivered a strong headline – one that surpassed most estimates. However, optimism quickly faded amid sobering benchmark revisions.
RECOMMENDED LESSONS
Making money in forex is easy if you know how the bankers trade!
I’m often mystified in my educational forex articles why so many traders struggle to make consistent money out of forex trading. The answer has more to do with what they don’t know than what they do know. After working in investment banks for 20 years many of which were as a Chief trader its second knowledge how to extract cash out of the market.
5 Forex News Events You Need To Know
In the fast moving world of currency markets where huge moves can seemingly come from nowhere, it is extremely important for new traders to learn about the various economic indicators and forex news events and releases that shape the markets. Indeed, quickly getting a handle on which data to look out for, what it means, and how to trade it can see new traders quickly become far more profitable and sets up the road to long term success.
Top 10 Chart Patterns Every Trader Should Know
Chart patterns are one of the most effective trading tools for a trader. They are pure price-action, and form on the basis of underlying buying and selling pressure. Chart patterns have a proven track-record, and traders use them to identify continuation or reversal signals, to open positions and identify price targets.
7 Ways to Avoid Forex Scams
The forex industry is recently seeing more and more scams. Here are 7 ways to avoid losing your money in such scams: Forex scams are becoming frequent. Michael Greenberg reports on luxurious expenses, including a submarine bought from the money taken from forex traders. Here’s another report of a forex fraud. So, how can we avoid falling in such forex scams?
What Are the 10 Fatal Mistakes Traders Make
Trading is exciting. Trading is hard. Trading is extremely hard. Some say that it takes more than 10,000 hours to master. Others believe that trading is the way to quick riches. They might be both wrong. What is important to know that no matter how experienced you are, mistakes will be part of the trading process.
The challenge: Timing the market and trader psychology
Successful trading often comes down to timing – entering and exiting trades at the right moments. Yet timing the market is notoriously difficult, largely because human psychology can derail even the best plans. Two powerful emotions in particular – fear and greed – tend to drive trading decisions off course.