![]() Markus Heitkoetter
Markus Heitkoetter
Rockwell Trading
Last Wednesday, I warned during my live show that the market could crash soon.
And it did:
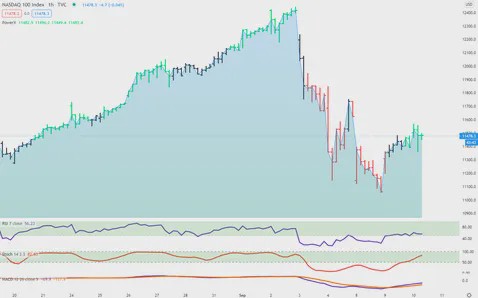
The next day the NASDAQ lost more than 5% — and for the next few days it kept moving lower.
And not to brag, but I pretty much nailed my prediction:
I said the S&P would correct to 3,400 and then bounce back. Well, I was off by a few points. It went down to 3,330 and then bounced back. Close enough
So why did the stock market just have a bit of a flash crash?
And will they keep crashing, or is the worst over now?
In order to answer the question “why are the markets crashing,” let’s back off for a moment and discuss why stocks exist in the first place.
At some point, a company may need to raise capital, and they don’t necessarily want to borrow it from the bank. So they sell parts of the company to investors, and these are shares.
Let’s take a look at a company like Apple APPL:
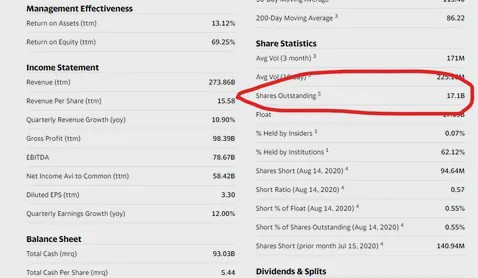
They have issued 17.1 BILLION shares.
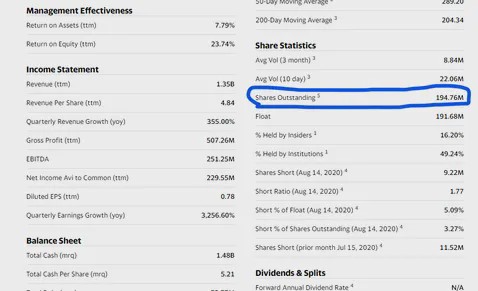
Now let’s compare this to another company that has been incredibly popular this year, Zoom Communications (ZM). They have issued 194.76 Million shares. As you can see, that’s much less.
EPS and a market crash?
So in order to compare these 2 companies, smart people (way smarter than me) came up with the idea of creating a metric, the EPS, or Earnings Per Share.
This metric tells you how much a company earns per ONE share of stock that they issue. So for AAPL that’s $3.30 and for ZOOM that’s $0.78.
As you can see, AAPL is much more profitable per share that they have issued compared to ZM. No surprise.
Now… what does THIS all have to do with the market crashing? Bear with me… you’ll see in a moment.
So now you know about the “EPS” — the Earnings Per Share. The next key metric that you need to know is the “P/E” ratio.
PE ratio or price per earnings
The PE ratio is the “price per earning,” so you take the stock price and divide it by the earnings per share (the profit) of the company. This PE ratio tells you how much overvalued or undervalued a company is.
Let’s take a look at the PE values of AAPL and ZM.
For AAPL, the PE ratio is 35.79. So this means that the stock is trading at 35x the profits. For ZM, it is a whopping 490!!! The stock price is 490 times the earnings! That’s crazy!
So let’s see what’s normal.
Here’s the PE ratio of the S&P 500 companies.
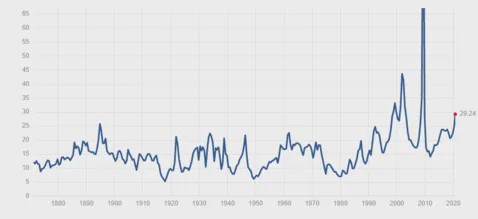
Right now, it’s 29.24, so almost 30. Apple’s PE ratio is 35, so it’s close to the average of the S&P 500 companies.
But AAPL is a tech stock, and we know that the NASDAQ is the “tech index.” So let’s take a look at the PE Ratio of the NASDAQ.
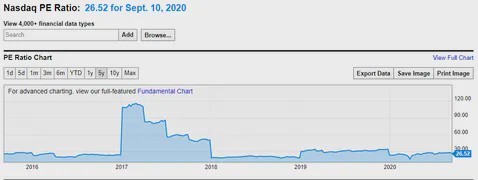
It’s 26.52 right now.
Wait, what???
I thought everybody was saying that tech stocks are overvalued???
Well, it seems they are in line with the S&P 500, and it’s also in line with its historic averages.
So why is everybody saying that stocks are overvalued right now? And why did the market crash?
Well, there’s a simple explanation. Let’s dive a little bit deeper into the NASDAQ.
There are 100 companies in the NASDAQ Index, and here’s how they are weighted.
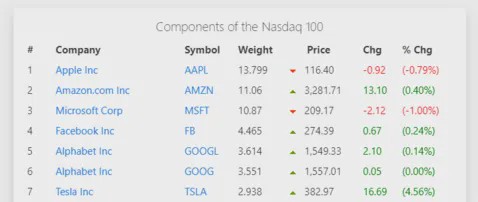
As you can see, the Top 7 companies make 50% of the weight of the index.
We already looked at Apple and know that their P/E ratio is at 35 right now, and that’s AFTER the correction. So it’s still higher than the average of 26.52 but not too crazy.
Let’s take a look at the others PE Ratio:
2.) AMZN: 126.
3.) MSFT: 37
4.) FB: 33
5.) GOOGL: 34
6.) GOOG: 35
7.) TSLA: 907
So as you can see, these 7 companies currently account for 50% of the NASDAQ, and are all trading higher than the average, with AMZN and TSLA being crazily overvalued.
And simply put, that’s why the market crashed.
At some point, the big hedge fund guys realized, “Oh man, we have some crazy stocks here in our portfolio! They are overvalued!” And so the big guys are taking some profits off the table and SELLING these heavily overvalued companies.
And if they “only” sell shares of these 7 companies, then it drags the whole Nasdaq down.
So will the market continue to move lower?
Earlier this year, the NASDAQ lost 30%. Can this happen again, or is over after this 10% drop? Well, we had this pandemic, and NOBODY knew how it would affect our economy. So the big guys did what they usually do when there’s uncertainty: SELL and sit on a pile of cash, like Warren Buffet.
But you’re not earning any money on cash. At some point, you need to invest the money again in the market.
And once we had a better idea of how the virus affected our economy, the big guys started buying again.
So if we look at this “flash crash” in September 2020, here’s what happened: The big guys — a.k.a SMART MONEY — noticed that some of the stocks that they purchased went up too much, and they sold them to take profits.
But they can’t sit on the cash for long. They need to earn money, so they invest it again after values are back to normal. And that’s what we are seeing today: It’s called “buying the dip.”
Summary: Why did the markets crash?
You should now be familiar with both EPS (Earnings Per Share) and the PE Ratio (Price Per Earnings).
And you know that the big guys — the smart money — they’re keeping a close eye on these numbers.
If they get too high, then they SELL some stocks and realize a profit, and they buy companies with a lower PE ratio.
And THAT is why the markets crashed for a few days — and why they are bouncing back right now.
Trading Futures, options on futures and retail off-exchange foreign currency transactions involves substantial risk of loss and is not suitable for all investors. You should carefully consider whether trading is suitable for you in light of your circumstances, knowledge, and financial resources. You may lose all or more of your initial investment. The lower the day trade margin, the higher the leverage and riskier the trade. Leverage can work for you as well as against you; it magnifies gains as well as losses. Past performance is not necessarily indicative of future results.
Editors’ Picks

EUR/USD flirts with daily highs, retargets 1.1900
EUR/USD regains upside traction, returning to the 1.1880 zone and refocusing its attention to the key 1.1900 barrier. The pair’s slight gains comes against the backdrop of a humble decline in the US Dollar as investors continue to assess the latest US CPI readings and the potential Fed’s rate path.

GBP/USD remains well bid around 1.3650
GBP/USD maintains its upside momentum in place, hovering around daily highs near 1.3650 and setting aside part of the recent three-day drop. Cable’s improved sentiment comes on the back of the Greenback’s irresolute price action, while recent hawkish comments from the BoE’s Pill also collaborate with the uptick.

USD/JPY edges up above 153.50 with all eyes on US CPI figures
USD/JPY appreciates above 153.00 but remains on track for a 2.4% weekly loss. Trading volumes remain subdued on Friday, ahead of the IS CPI release. The Yen remains supported by hopes of a stable government and calls for further BoJ tightening.
Editors’ Picks

EUR/USD: Yes, the US economy is resilient – No, that won’t save the US Dollar Premium
Some impressive US data should have resulted in a much stronger USD. Well, it didn’t happen. The EUR/USD pair closed a third consecutive week little changed, a handful of pips above the 1.1800 mark.

Gold: Metals remain vulnerable to broad market mood Premium
Gold (XAU/USD) started the week on a bullish note and climbed above $5,000 before declining sharply and erasing its weekly gains on Thursday, only to recover heading into the weekend.

GBP/USD: Pound Sterling remains below 1.3700 ahead of UK inflation test Premium
The Pound Sterling (GBP) failed to resist at higher levels against the US Dollar (USD), but buyers held their ground amid a US data-busy blockbuster week.

Bitcoin: BTC bears aren’t done yet
Bitcoin (BTC) price slips below $67,000 at the time of writing on Friday, remaining under pressure and extending losses of nearly 5% so far this week.

US Dollar: Big in Japan Premium
The US Dollar (USD) resumed its yearly downtrend this week, slipping back to two-week troughs just to bounce back a tad in the second half of the week.
RECOMMENDED LESSONS
Making money in forex is easy if you know how the bankers trade!
I’m often mystified in my educational forex articles why so many traders struggle to make consistent money out of forex trading. The answer has more to do with what they don’t know than what they do know. After working in investment banks for 20 years many of which were as a Chief trader its second knowledge how to extract cash out of the market.
5 Forex News Events You Need To Know
In the fast moving world of currency markets where huge moves can seemingly come from nowhere, it is extremely important for new traders to learn about the various economic indicators and forex news events and releases that shape the markets. Indeed, quickly getting a handle on which data to look out for, what it means, and how to trade it can see new traders quickly become far more profitable and sets up the road to long term success.
Top 10 Chart Patterns Every Trader Should Know
Chart patterns are one of the most effective trading tools for a trader. They are pure price-action, and form on the basis of underlying buying and selling pressure. Chart patterns have a proven track-record, and traders use them to identify continuation or reversal signals, to open positions and identify price targets.
7 Ways to Avoid Forex Scams
The forex industry is recently seeing more and more scams. Here are 7 ways to avoid losing your money in such scams: Forex scams are becoming frequent. Michael Greenberg reports on luxurious expenses, including a submarine bought from the money taken from forex traders. Here’s another report of a forex fraud. So, how can we avoid falling in such forex scams?
What Are the 10 Fatal Mistakes Traders Make
Trading is exciting. Trading is hard. Trading is extremely hard. Some say that it takes more than 10,000 hours to master. Others believe that trading is the way to quick riches. They might be both wrong. What is important to know that no matter how experienced you are, mistakes will be part of the trading process.
The challenge: Timing the market and trader psychology
Successful trading often comes down to timing – entering and exiting trades at the right moments. Yet timing the market is notoriously difficult, largely because human psychology can derail even the best plans. Two powerful emotions in particular – fear and greed – tend to drive trading decisions off course.