![]() Sam Seiden
Sam Seiden
Independent Analyst
24/7 market analysis… financial news TV shows, Youtube channels, Podcasts and so on focus on analyzing economic reports, corporate earnings and so much more. Most of the time, you have a panel of financial experts arguing whether a number is good or bad for markets. In this day and age, this type of analysis and reporting is endless.
Think about this… What is the goal of all that talk, debate and analysis? Often, you have two ivy league economists debating an economic report, and they both sound correct. My big question, again, is this… What is the goal of all that market analysis and debate? At the end of the day, isn’t all the talk to figure out where market price is going to turn and where price is going to go? If these are the two questions that the 24/7 talk is aimed at figuring out, why not just focus on that? Meaning, skip all the talk and analysis and go right to the only two questions that matter. Literally, don’t consider the news, the data, opinions or anything else. Skip all that and focus on the only information that matters. Here is how we do it…
I have been in the trading business for nearly 20 years as a trader, fund manager and educator. I began on the floor of the Chicago Mercantile Exchange on the institution side of the business. What was clear to me then, and will be forever, is that how prices move in any and all markets is a function of a simple supply and demand equation. Trading or investing opportunity exists when this simple and straight forward relationship is out of balance. How do we see this on a price chart?
-
Where will price turn in a market? Price in any market turns at price levels where demand and supply are out of balance. Meaning that, unfilled buy or sell orders cause price to turn.
-
Where will price go? Price moves easiest through price points where you don’t have a significant supply and demand imbalance. Meaning that, price points where orders are filled make it easy for price to move, keep going.
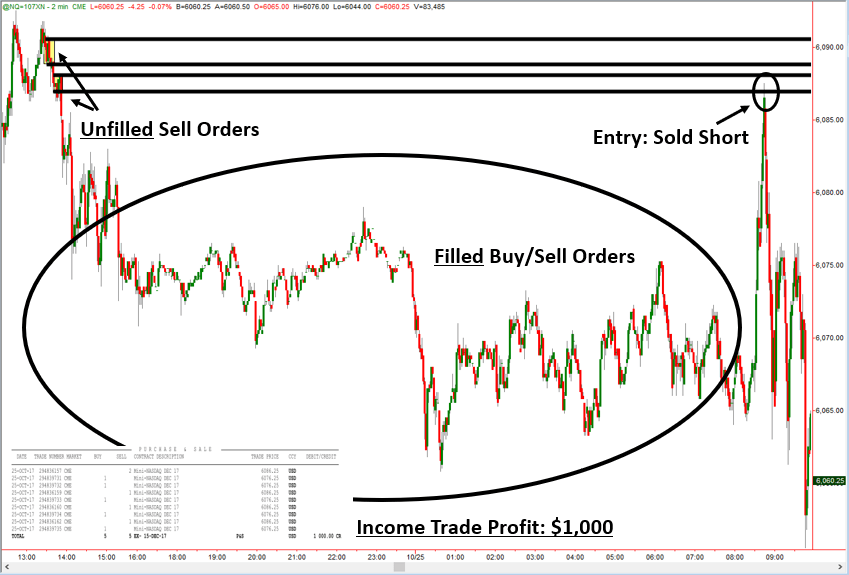
Notice the area labeled “unfilled sell orders” is the origin of a strong decline in price. This is exactly where the significant sellers (banks) are selling; we call this a Supply Zone. Next, notice how quickly price rallied up to supply where I sold short. Price then turned lower and reached the profit target.
Price turned because it reached a price level with significant “unfilled” sell orders. It then moved quickly lower because it was moving through an area where most of the orders were filled, a lack of unfilled buy orders. There are a few rule-based items we look for in the two pictures that represent filled and unfilled orders. For example, in the circled area, notice the large amount of trading that took place and the wide and whippy action. This is the picture of filled orders. If that was not the case and there was a large amount of unfilled orders, the picture would certainly look opposite of what it does, like the unfilled orders supply levels above.
Keep in mind that any and all influences on price are reflected in price. Whether you trade Stocks, Futures, Forex or Options, understand that behind all the candles on your screen in all these markets are people and their buy and sell decisions. The picture of filled and unfilled orders on a chart is crystal clear if you know what you’re looking for. The biggest issue is that everyone is doing market analysis and arguing over data and reports instead of focusing on the only two questions that matter. It’s a big step toward simplicity which most will never be comfortable with. So much truth in the world is cluttered with… well just that, clutter. If you care about your hard earned money, you may not want your money mind to be cluttered with anything that doesn’t directly put more money in your pocket.
To summarize – Unfilled orders cause price to turn. Filled orders facilitate price movement.
Note: All information on this page is subject to change. The use of this website constitutes acceptance of our user agreement. Please read our privacy policy and legal disclaimer. Opinions expressed at FXstreet.com are those of the individual authors and do not necessarily represent the opinion of FXstreet.com or its management. Risk Disclosure: Trading foreign exchange on margin carries a high level of risk, and may not be suitable for all investors. The high degree of leverage can work against you as well as for you. Before deciding to invest in foreign exchange you should carefully consider your investment objectives, level of experience, and risk appetite. The possibility exists that you could sustain a loss of some or all of your initial investment and therefore you should not invest money that you cannot afford to lose. You should be aware of all the risks associated with foreign exchange trading, and seek advice from an independent financial advisor if you have any doubts.
Editors’ Picks

EUR/USD stays defensive below 1.1900 as USD recovers
EUR/USD trades in negative territory for the third consecutive day, below 1.1900 in the European session on Thursday. A modest rebound in the US Dollar is weighing on the pair, despite an upbeat market mood. Traders keep an eye on the US weekly Initial Jobless Claims data for further trading impetus.

GBP/USD holds above 1.3600 after UK data dump
\GBP/USD moves little while holding above 1.3600 in the European session on Thursday, following the release of the UK Q4 preliminary GDP, which showed a 0.1% growth against a 0.2% increase expected. The UK industrial sector activity deteriorated in Decembert, keeping the downward pressure intact on the Pound Sterling.

Japanese Yen strengthens on renewed verbal intervention
USD/JPY extends its losses for the fourth successive session, trading around 152.90 during the Asian hours on Thursday. The pair weakens as the Japanese Yen strengthens following renewed verbal intervention from Tokyo.
Editors’ Picks
GBP/USD holds above 1.3600 after UK data dump
\GBP/USD moves little while holding above 1.3600 in the European session on Thursday, following the release of the UK Q4 preliminary GDP, which showed a 0.1% growth against a 0.2% increase expected. The UK industrial sector activity deteriorated in Decembert, keeping the downward pressure intact on the Pound Sterling.
EUR/USD stays defensive below 1.1900 as USD recovers
EUR/USD trades in negative territory for the third consecutive day, below 1.1900 in the European session on Thursday. A modest rebound in the US Dollar is weighing on the pair, despite an upbeat market mood. Traders keep an eye on the US weekly Initial Jobless Claims data for further trading impetus.

Gold sticks to modest intraday losses as reduced March Fed rate cut bets underpin USD
Gold languishes near the lower end of its daily range heading into the European session on Thursday. The precious metal, however, lacks follow-through selling amid mixed cues and currently trades above the $5,050 level, well within striking distance of a nearly two-week low touched the previous day.

Cardano eyes short-term rebound as derivatives sentiment improves
Cardano (ADA) is trading at $0.257 at the time of writing on Thursday, after slipping more than 4% so far this week. Derivatives sentiment improves as ADA’s funding rates turn positive alongside rising long bets among traders.

The market trades the path not the past
The payroll number did not just beat. It reset the tone. 130,000 vs. 65,000 expected, with a 35,000 whisper. 79 of 80 economists leaning the wrong way. Unemployment and underemployment are edging lower. For all the statistical fog around birth-death adjustments and seasonal quirks, the core message was unmistakable. The labour market is not cracking.
RECOMMENDED LESSONS
Making money in forex is easy if you know how the bankers trade!
I’m often mystified in my educational forex articles why so many traders struggle to make consistent money out of forex trading. The answer has more to do with what they don’t know than what they do know. After working in investment banks for 20 years many of which were as a Chief trader its second knowledge how to extract cash out of the market.
5 Forex News Events You Need To Know
In the fast moving world of currency markets where huge moves can seemingly come from nowhere, it is extremely important for new traders to learn about the various economic indicators and forex news events and releases that shape the markets. Indeed, quickly getting a handle on which data to look out for, what it means, and how to trade it can see new traders quickly become far more profitable and sets up the road to long term success.
Top 10 Chart Patterns Every Trader Should Know
Chart patterns are one of the most effective trading tools for a trader. They are pure price-action, and form on the basis of underlying buying and selling pressure. Chart patterns have a proven track-record, and traders use them to identify continuation or reversal signals, to open positions and identify price targets.
7 Ways to Avoid Forex Scams
The forex industry is recently seeing more and more scams. Here are 7 ways to avoid losing your money in such scams: Forex scams are becoming frequent. Michael Greenberg reports on luxurious expenses, including a submarine bought from the money taken from forex traders. Here’s another report of a forex fraud. So, how can we avoid falling in such forex scams?
What Are the 10 Fatal Mistakes Traders Make
Trading is exciting. Trading is hard. Trading is extremely hard. Some say that it takes more than 10,000 hours to master. Others believe that trading is the way to quick riches. They might be both wrong. What is important to know that no matter how experienced you are, mistakes will be part of the trading process.
The challenge: Timing the market and trader psychology
Successful trading often comes down to timing – entering and exiting trades at the right moments. Yet timing the market is notoriously difficult, largely because human psychology can derail even the best plans. Two powerful emotions in particular – fear and greed – tend to drive trading decisions off course.