![]() Brandon Wendell, CMT
Brandon Wendell, CMT
Brandon Wendell
Investors and traders have been watching in amazement as the equity markets have been steadily rising and reaching all-time price highs nearly every week. The big question on most people’s minds is, “When will it stop?” Or more importantly, “Is there a crash coming?”
Professional traders use price action to determine where future prices will likely go. This is difficult now because with the new highs, we do not have any supply to mark the probable top. Last week, the FANG stocks, (Facebook, Amazon, Netflix, and Google) caused the Nasdaq index to retreat quickly from highs. This may not be the peak of the market, however. It could be a small profit taking period or the start of a large correction. So how are traders supposed to know or react?
In past articles, I have highlighted the use of the Relative Strength Index (RSI) as a tool for measuring price momentum and changes in trend. We can apply this indicator to our index price charts and even individual securities to assist us in identifying future movement. As with any technical indicator, the RSI should be used as a confirming indicator, not a decision-making tool. Price and supply and demand should be the only thing you use for your decisions to enter or exit the markets.
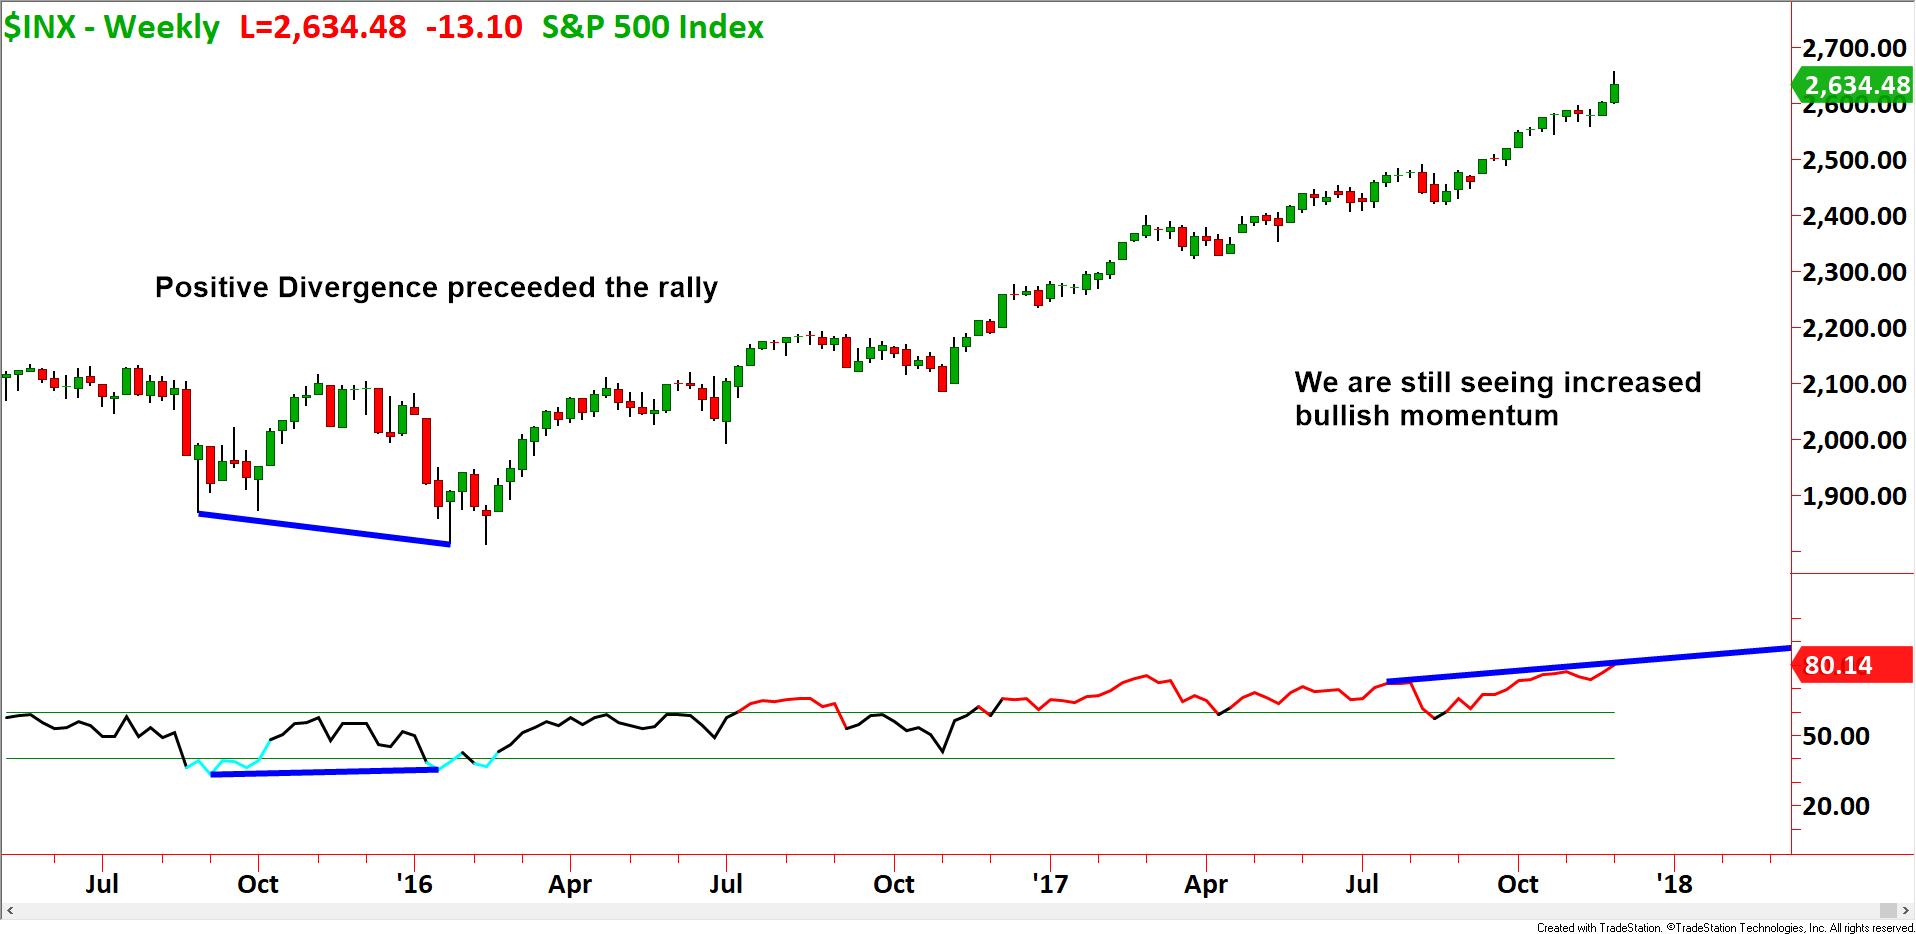
Looking at the chart below of the market crash in 2008, we can see that the RSI gave us several signals before prices dropped. The negative divergence of price and the indicator was a powerful signal, warning investors of weakness in the market.

Looking now at the current weekly chart of the S&P 500, we do not have such a signal yet. The momentum is still strong while prices are making new highs. This suggests the trend will continue for now.
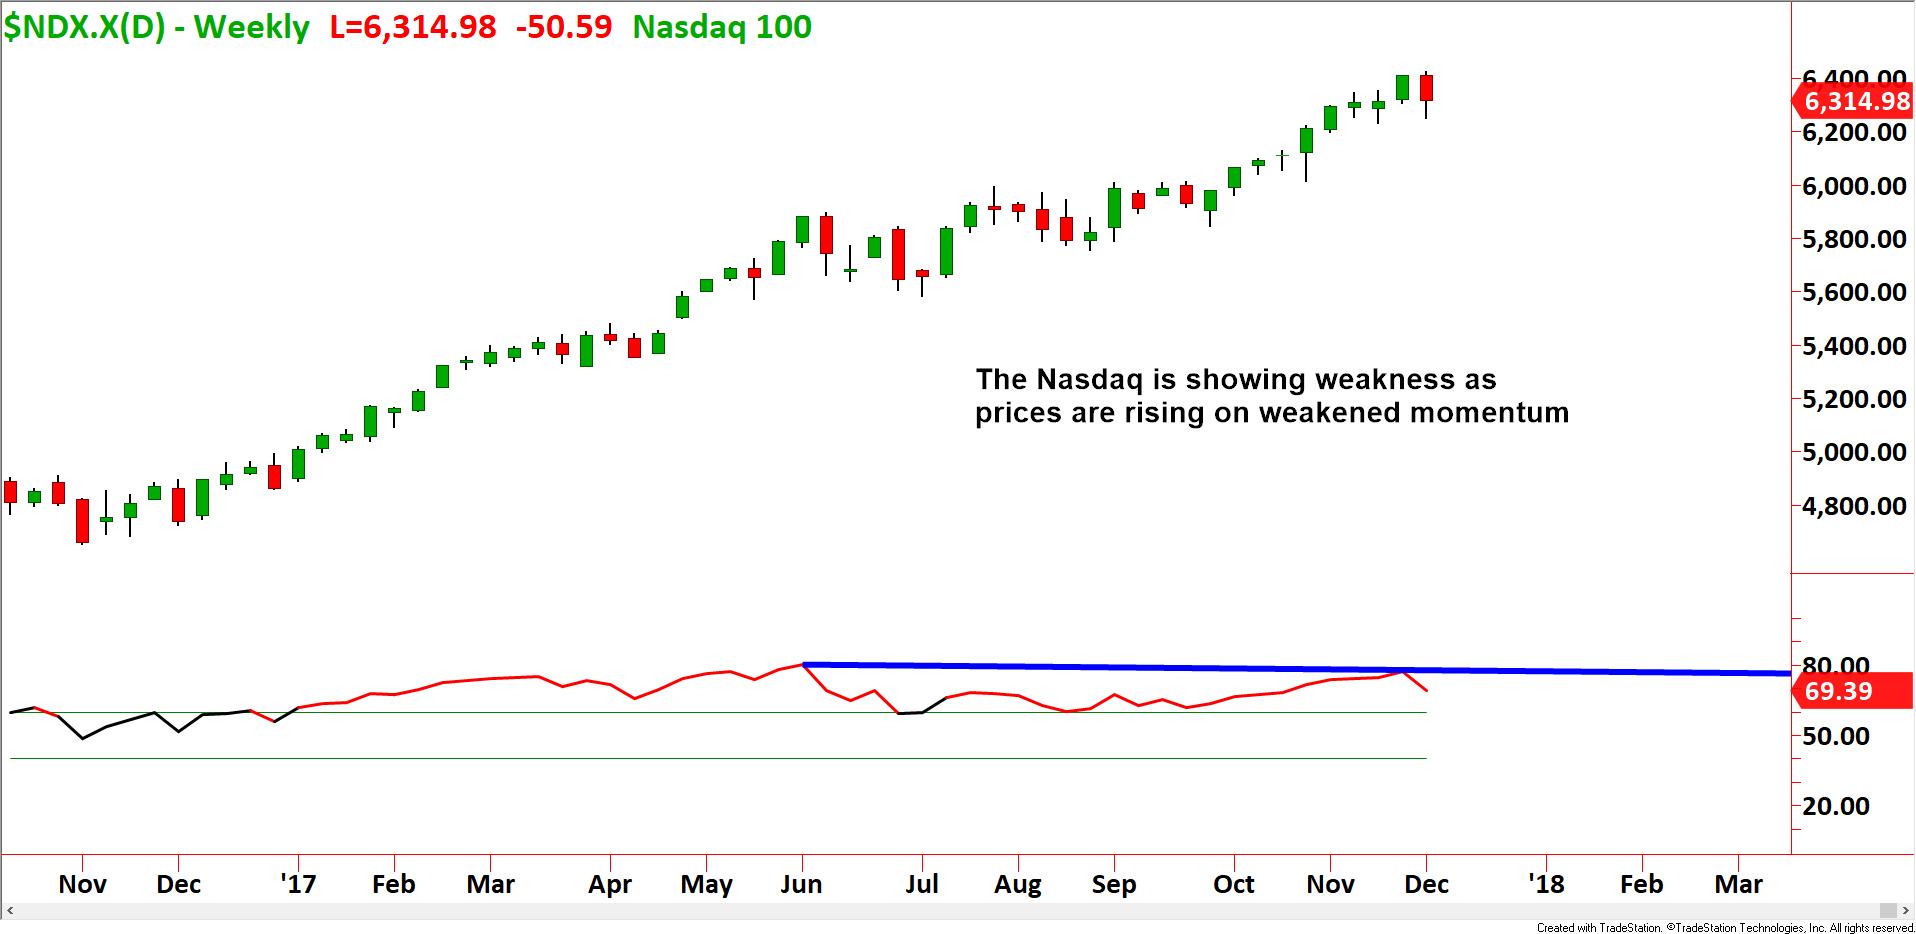
Turning to the Nasdaq index, we see a different picture. While prices have been moving to new highs, the momentum is dropping. This negative divergence is a warning for those invested in tech stocks.
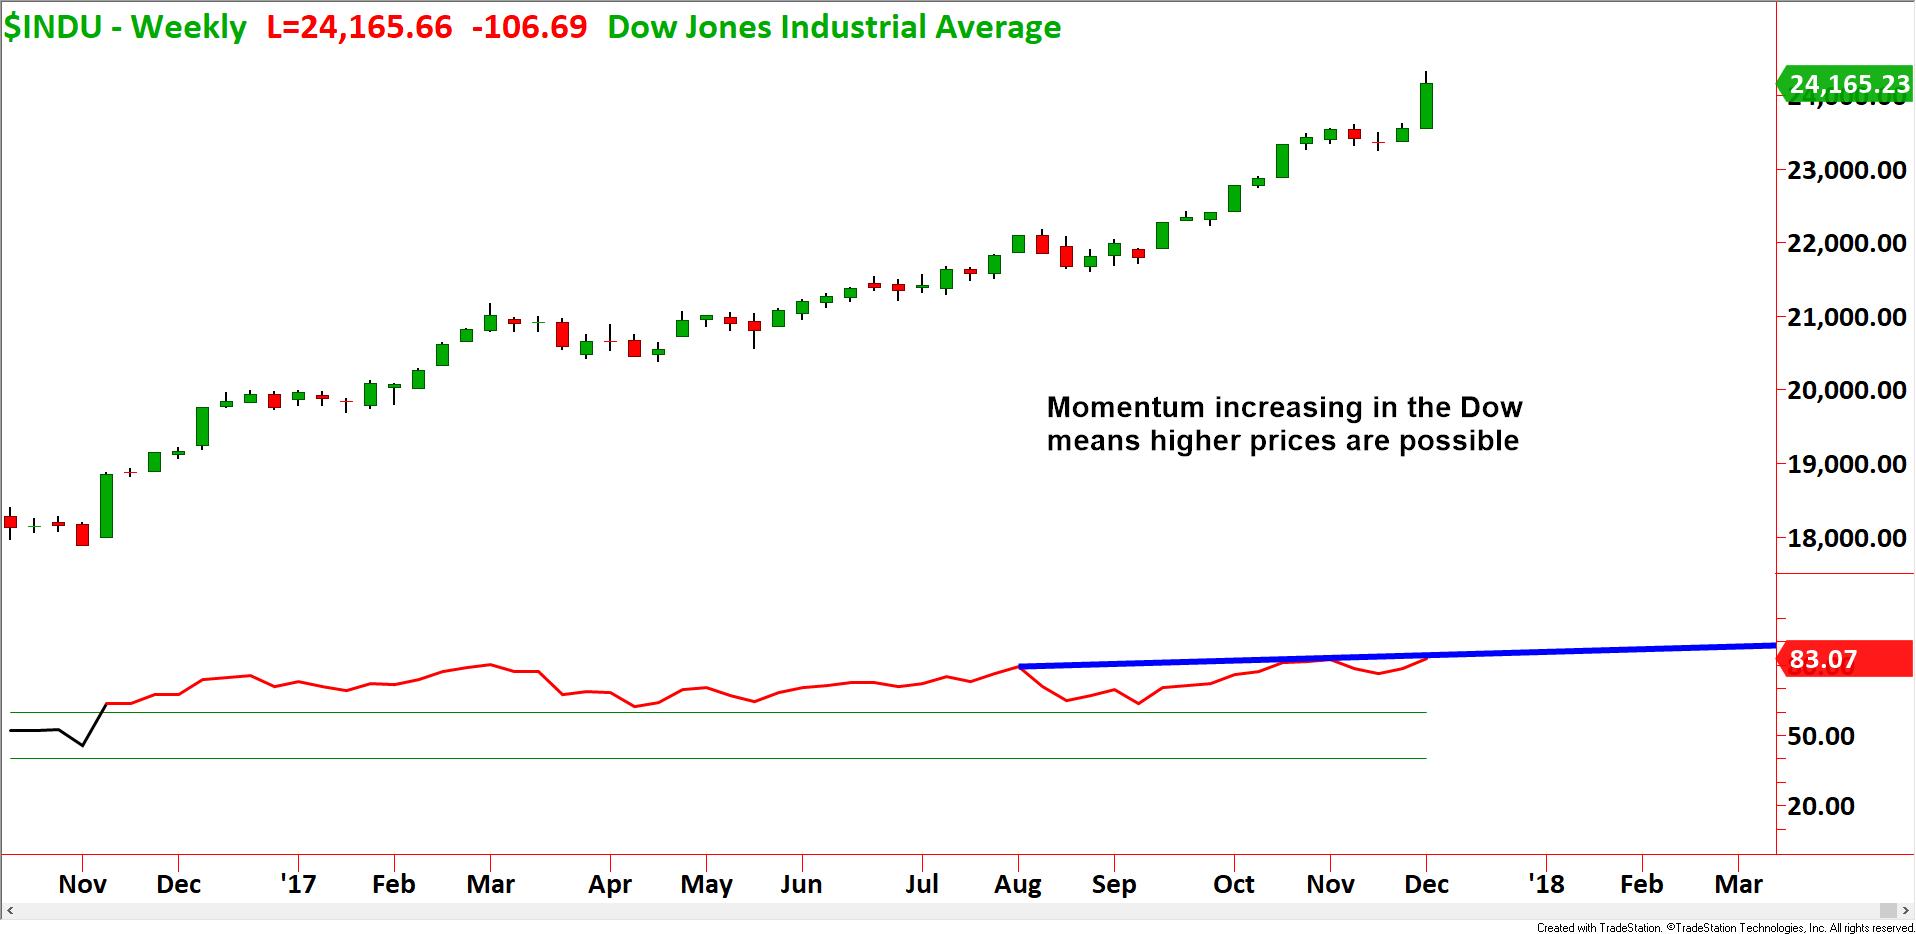
The Dow Jones Industrial Average is following the path of the S&P 500 and moving higher on increased momentum suggesting continued bullish movement.
The proverbial canary in the mine shaft for the indexes is usually the Russell 2000 index. Since the index consists of smaller US based companies without as much international exposure, it usually reflects the American economy better than the other indexes. It was the first index to drop in the 2008 crash, and also the first to recover.

Currently it is also exhibiting negative divergence like the Nasdaq. This is a bearish sign. Don’t panic though. The warning is only on two of four indexes. We are likely to continue to see higher prices and new highs. The divergence is only a warning, not the signal to sell or sell short.
To know when the time is right to short the markets, you need to understand how to identify the dominant trend in price. This is critical, because if you try to short in an uptrend you will likely suffer losses. When it comes to trading in the trend, you do not always have to be first, but you do not want to be wrong.
Visit your local Online Trading Academy office today and discover how you can learn to read price and trends the professional way in small classes taught by active, profitable traders.
Neither Freedom Management Partners nor any of its personnel are registered broker-dealers or investment advisers. I will mention that I consider certain securities or positions to be good candidates for the types of strategies we are discussing or illustrating. Because I consider the securities or positions appropriate to the discussion or for illustration purposes does not mean that I am telling you to trade the strategies or securities. Keep in mind that we are not providing you with recommendations or personalized advice about your trading activities. The information we are providing is not tailored to any individual. Any mention of a particular security is not a recommendation to buy, sell, or hold that or any other security or a suggestion that it is suitable for any specific person. Keep in mind that all trading involves a risk of loss, and this will always be the situation, regardless of whether we are discussing strategies that are intended to limit risk. Also, Freedom Management Partners’ personnel are not subject to trading restrictions. I and others at Freedom Management Partners could have a position in a security or initiate a position in a security at any time.
Editors’ Picks

EUR/USD hovers around nine-day EMA above 1.1800
EUR/USD remains in the positive territory after registering modest gains in the previous session, trading around 1.1820 during the Asian hours on Monday. The 14-day Relative Strength Index momentum indicator at 54 is edging higher, signaling improving momentum. RSI near mid-50s keeps momentum balanced. A sustained push above 60 would firm bullish control.

GBP/USD holds medium-term bullish bias above 1.3600
The GBP/USD pair trades on a softer note around 1.3605 during the early European session on Monday. Growing expectation of the Bank of England’s interest-rate cut weighs on the Pound Sterling against the Greenback.

USD/JPY drops back below 157.00 on Japan's verbal intervention
USD/JPY has come under moderate selling pressure below 157.00 in the Asian session on Monday. The Japanese Yen lost ground to near 157.70 following Japan’s ruling Liberal Democratic Party's outright majority win in Sunday’s lower house election, opening the door to more fiscal stimulus by Prime Minister Sanae Takaichi. However, JPY buyers jumped back and dragged the pair southward on FX verbal intervention by Japan’s Finance Minister Katayama.
Editors’ Picks
EUR/USD hovers around nine-day EMA above 1.1800
EUR/USD remains in the positive territory after registering modest gains in the previous session, trading around 1.1820 during the Asian hours on Monday. The 14-day Relative Strength Index momentum indicator at 54 is edging higher, signaling improving momentum. RSI near mid-50s keeps momentum balanced. A sustained push above 60 would firm bullish control.

Gold sticks to gains above $5,000 as China's buying and Fed rate-cut bets drive demand
Gold surges past the $5,000 psychological mark during the Asian session on Monday in reaction to the weekend data, showing that the People's Bank of China extended its buying spree for a 15th month in January. Moreover, dovish US Federal Reserve expectations and concerns about the central bank's independence drag the US Dollar lower for the second straight day, providing an additional boost to the non-yielding yellow metal.
GBP/USD holds medium-term bullish bias above 1.3600
The GBP/USD pair trades on a softer note around 1.3605 during the early European session on Monday. Growing expectation of the Bank of England’s interest-rate cut weighs on the Pound Sterling against the Greenback.

Bitcoin, Ethereum and Ripple consolidate after massive sell-off
Bitcoin, Ethereum, and Ripple prices consolidated on Monday after correcting by nearly 9%, 8%, and 10% in the previous week, respectively. BTC is hovering around $70,000, while ETH and XRP are facing rejection at key levels.

Weekly column: Saturn-Neptune and the end of the Dollar’s 15-year bull cycle
Tariffs are not only inflationary for a nation but also risk undermining the trust and credibility that go hand in hand with the responsibility of being the leading nation in the free world and controlling the world’s reserve currency.
RECOMMENDED LESSONS
Making money in forex is easy if you know how the bankers trade!
I’m often mystified in my educational forex articles why so many traders struggle to make consistent money out of forex trading. The answer has more to do with what they don’t know than what they do know. After working in investment banks for 20 years many of which were as a Chief trader its second knowledge how to extract cash out of the market.
5 Forex News Events You Need To Know
In the fast moving world of currency markets where huge moves can seemingly come from nowhere, it is extremely important for new traders to learn about the various economic indicators and forex news events and releases that shape the markets. Indeed, quickly getting a handle on which data to look out for, what it means, and how to trade it can see new traders quickly become far more profitable and sets up the road to long term success.
Top 10 Chart Patterns Every Trader Should Know
Chart patterns are one of the most effective trading tools for a trader. They are pure price-action, and form on the basis of underlying buying and selling pressure. Chart patterns have a proven track-record, and traders use them to identify continuation or reversal signals, to open positions and identify price targets.
7 Ways to Avoid Forex Scams
The forex industry is recently seeing more and more scams. Here are 7 ways to avoid losing your money in such scams: Forex scams are becoming frequent. Michael Greenberg reports on luxurious expenses, including a submarine bought from the money taken from forex traders. Here’s another report of a forex fraud. So, how can we avoid falling in such forex scams?
What Are the 10 Fatal Mistakes Traders Make
Trading is exciting. Trading is hard. Trading is extremely hard. Some say that it takes more than 10,000 hours to master. Others believe that trading is the way to quick riches. They might be both wrong. What is important to know that no matter how experienced you are, mistakes will be part of the trading process.
The challenge: Timing the market and trader psychology
Successful trading often comes down to timing – entering and exiting trades at the right moments. Yet timing the market is notoriously difficult, largely because human psychology can derail even the best plans. Two powerful emotions in particular – fear and greed – tend to drive trading decisions off course.