![]() Brandon Wendell, CMT
Brandon Wendell, CMT
Brandon Wendell
While most investors are enjoying the returns they are receiving from this bullish market, everyone knows that it cannot last forever. The big question that many are asking is where is the top? Normally, prices would reverse and drop from levels of supply on the higher time frames. When the markets are trading at all time highs, however, there are no supply zones with which to identify the turning points.
Strategies for Trading All-time Highs
There are two possibilities for traders trying to determine when to sell bullish positions or enter shorts. The first is to wait until the bearish trend has been confirmed. The second is to use a technical tool called Fibonacci Extensions to project potential turning points for price.
There are definite advantages and drawbacks to each method. Waiting for the trend change to confirm itself offers a higher probability but will cause you to give up some of your profits from your longs and will cut your profits down a bit on your shorts. Using the Fibonacci tools will get you out of longs closer to the top and increase your profits on your shorts, but you run the risk of entering too soon and getting stopped out for small losses.
You must weigh the rewards and weaknesses of the techniques and decide for yourself which you will use. Neither is necessarily better than the other. You just need to be comfortable with what you select and stay committed to it.
Identifying a Trend Change
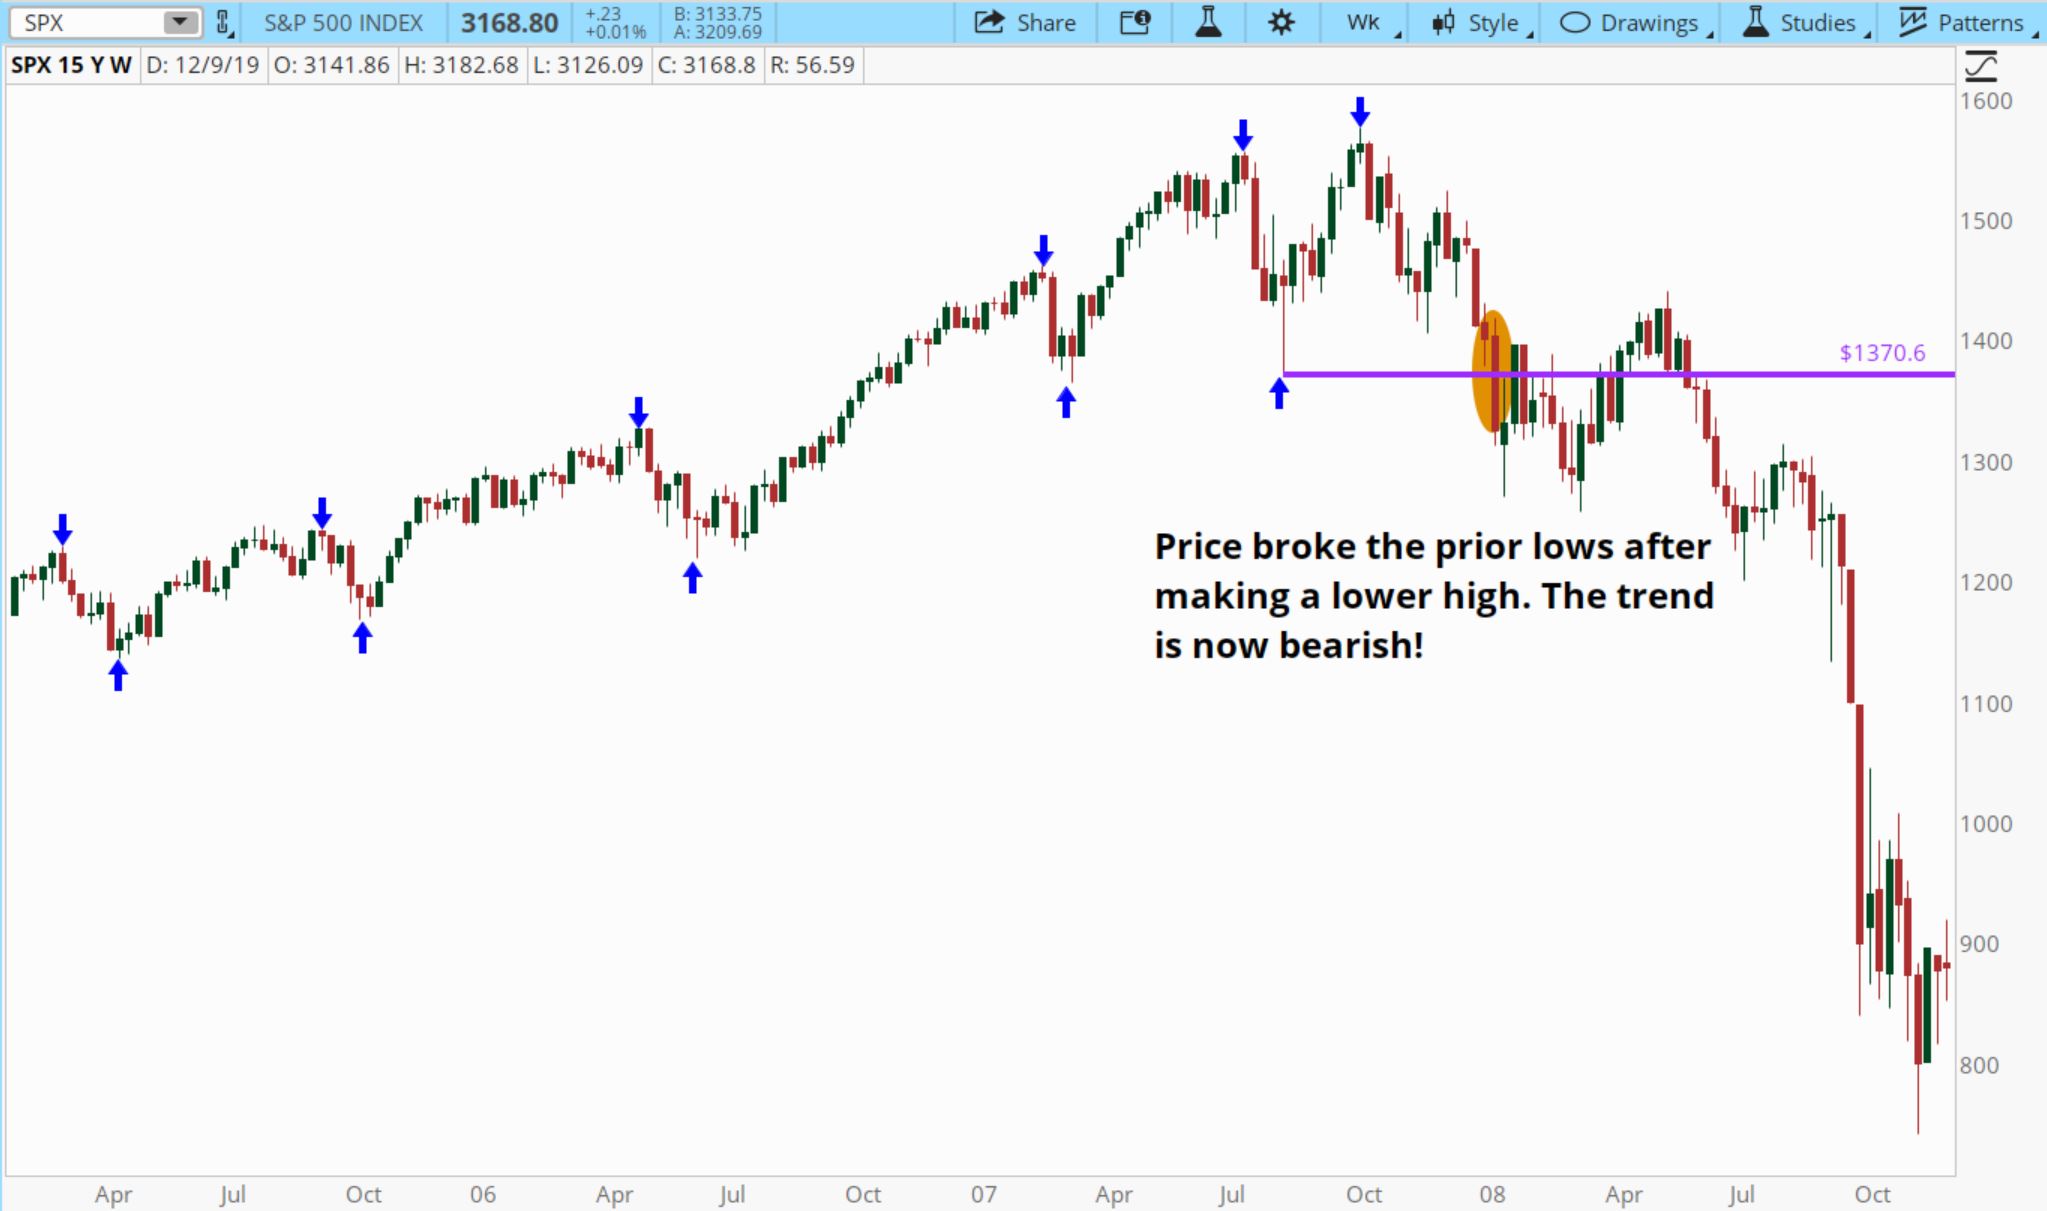
When evaluating the trend change, you must remember the definition of a trend and objectively read price action to ensure what you are seeing meets the criteria. An uptrend is a series of higher lows in price followed by higher highs. A downtrend is lower highs followed by lower lows. Be careful not to look at every high and low. The trick is to be able to identify the impulse and corrective movements in the markets. The starts and ends of those movements are the highs and lows you want to use.
Looking at the trend change from 2007 into 2008’s bear market, prices were making higher lows and highs on the weekly chart until late 2007. Once price made a lower low in January 2008, the bearish trend was confirmed. At this point, long positions should have been exited and shorts entered.
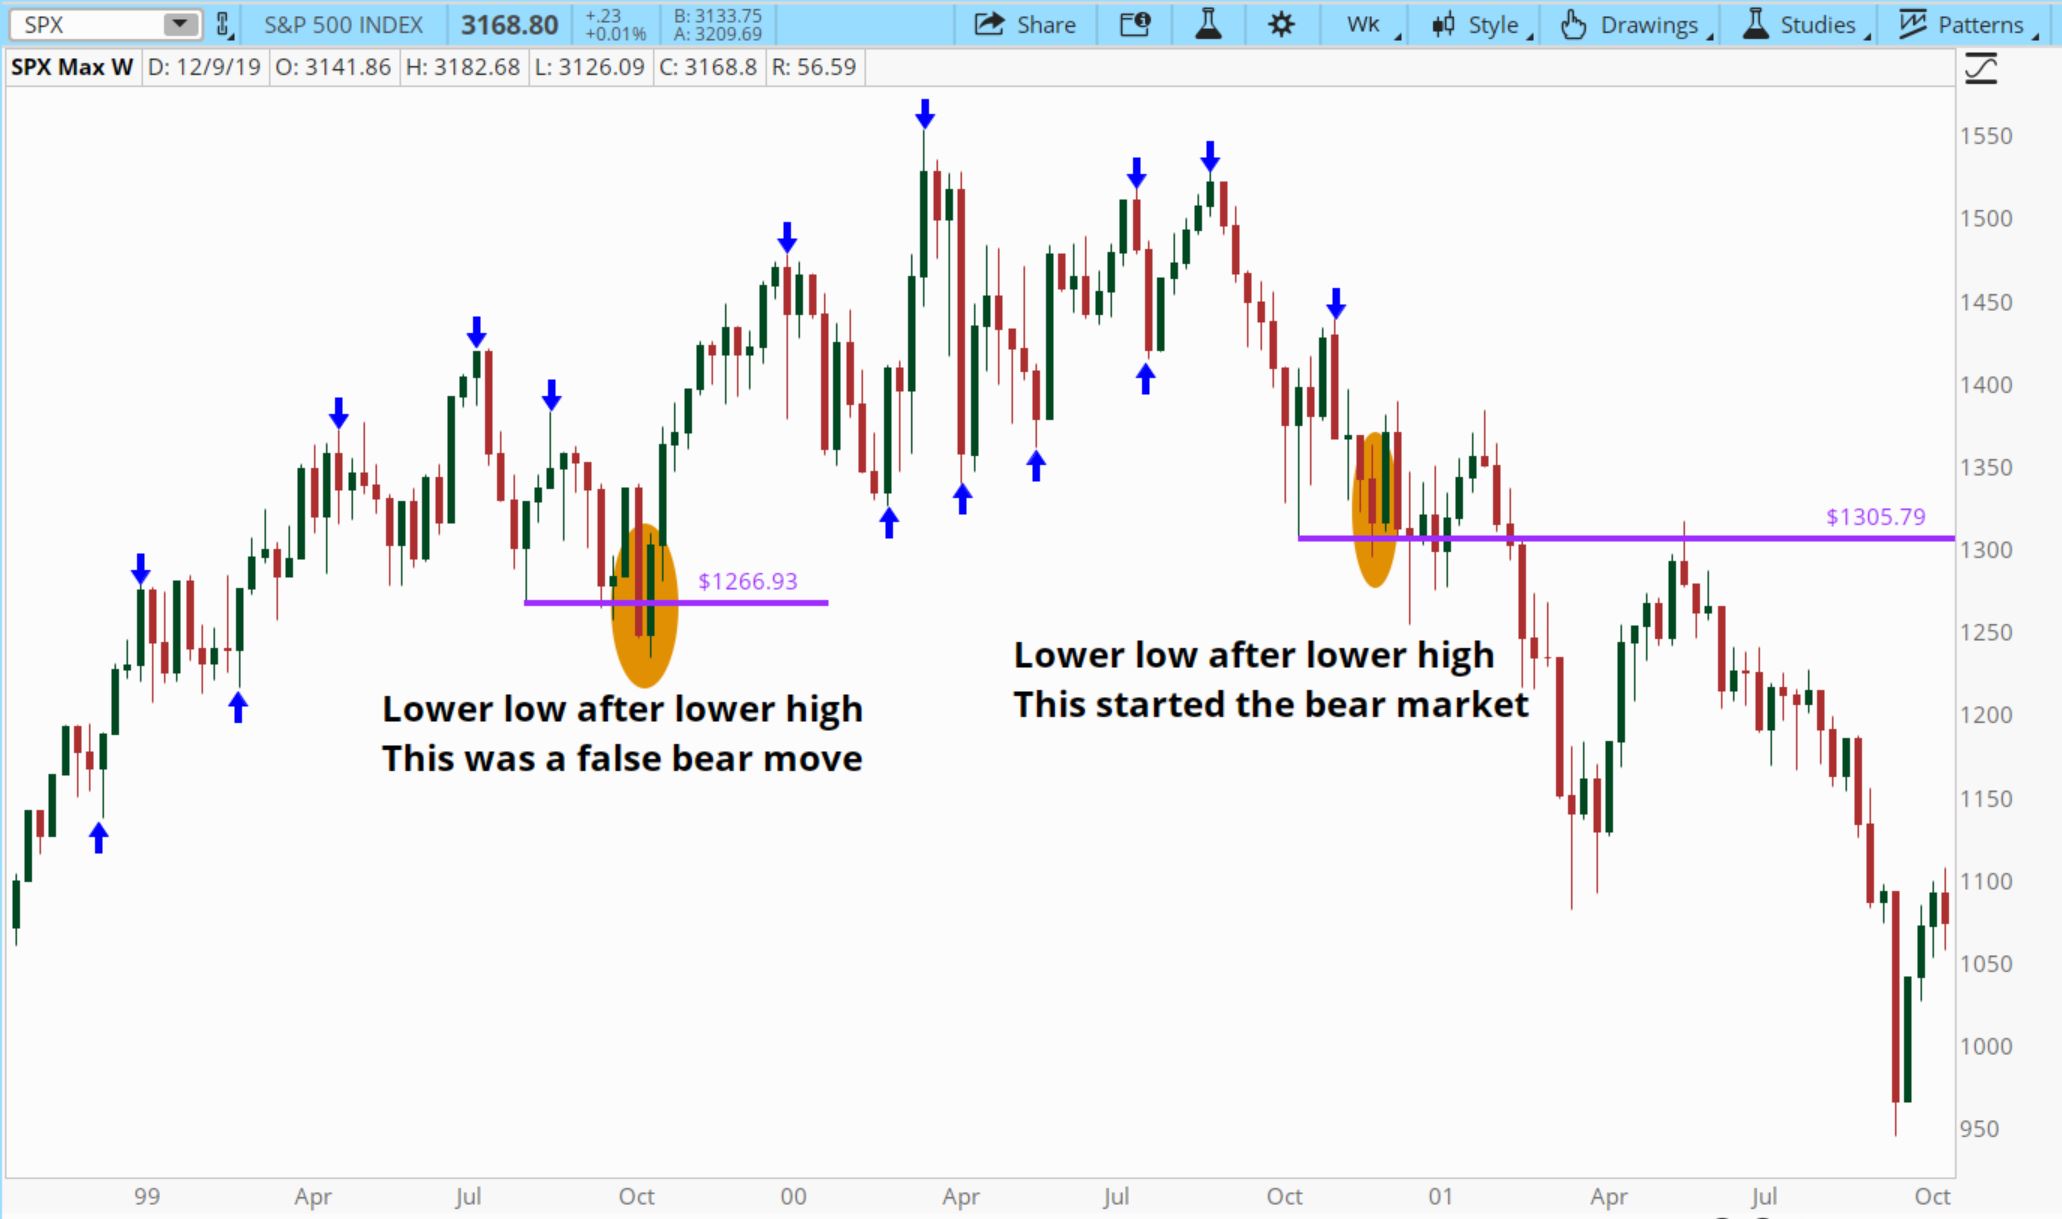
From time to time, there may be false signals given from price. Looking back to the weekly chart of the tech bubble in 1999-2000, prices gave a false signal before truly reversing. This is one of the disadvantages of using the trend change method.
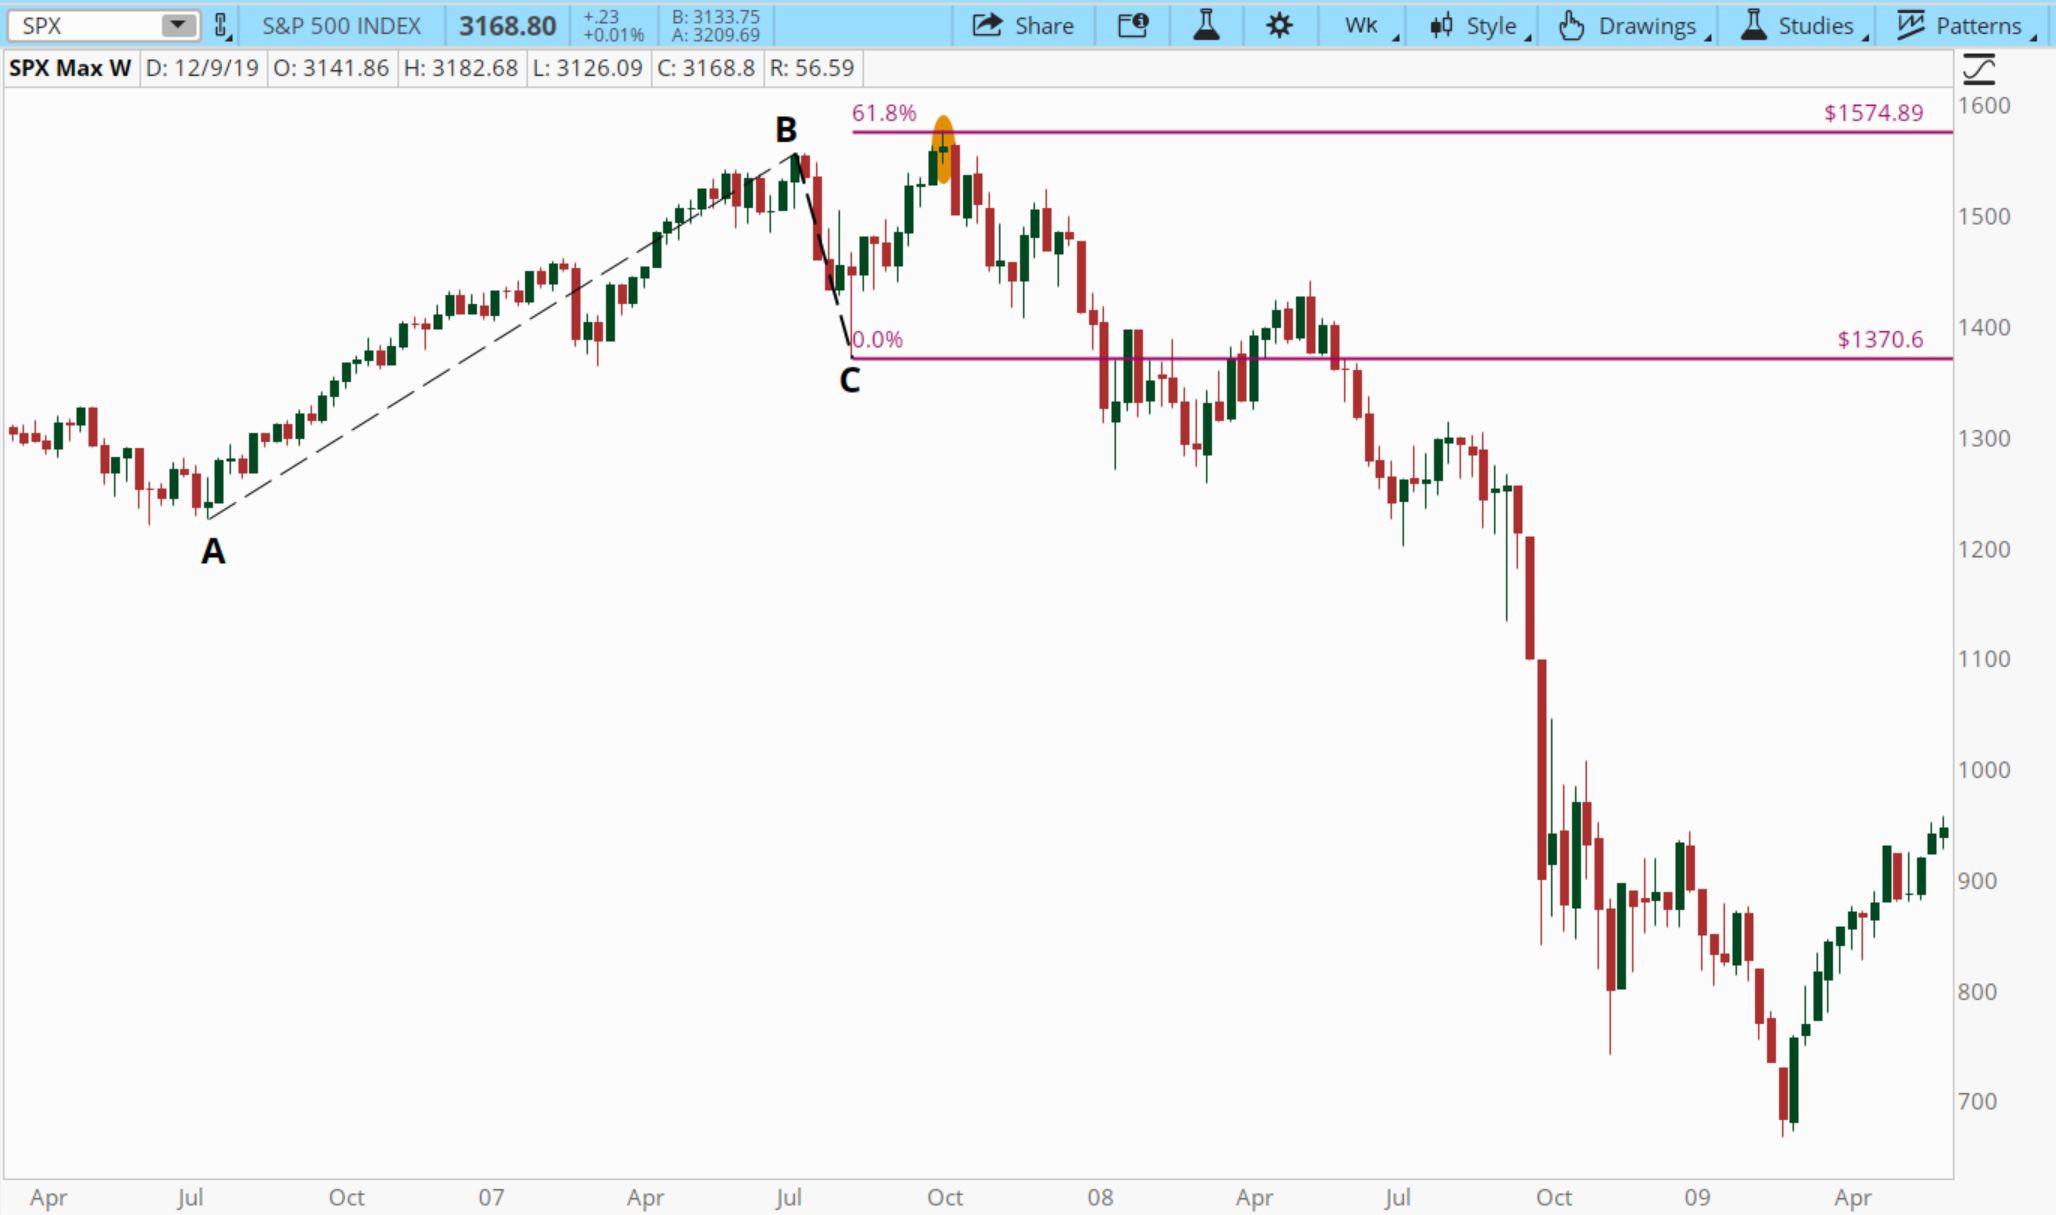
Using Fibonacci Extensions
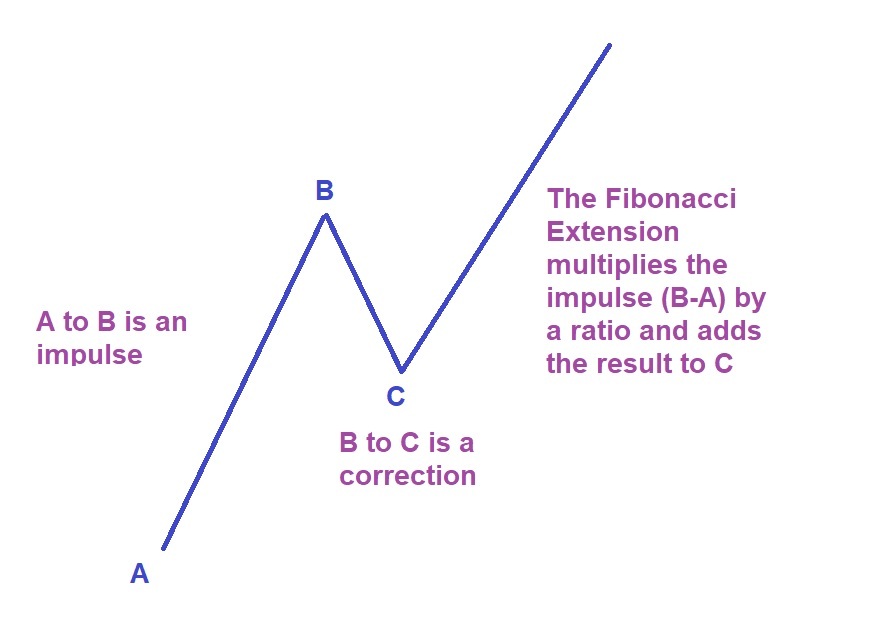
Fibonacci tools are based on a numerical sequence. There are certain ratios that hold importance and can be used to estimate potential turning points for price action. When we are making all-time highs, price is said to be impulsing higher. This impulse will follow a correction of a previous impulse. To predict where the impulse is likely to end, the Fibonacci Extension tool multiplies the preceding impulse by certain ratios and projects that measurement from the recent retracement point.
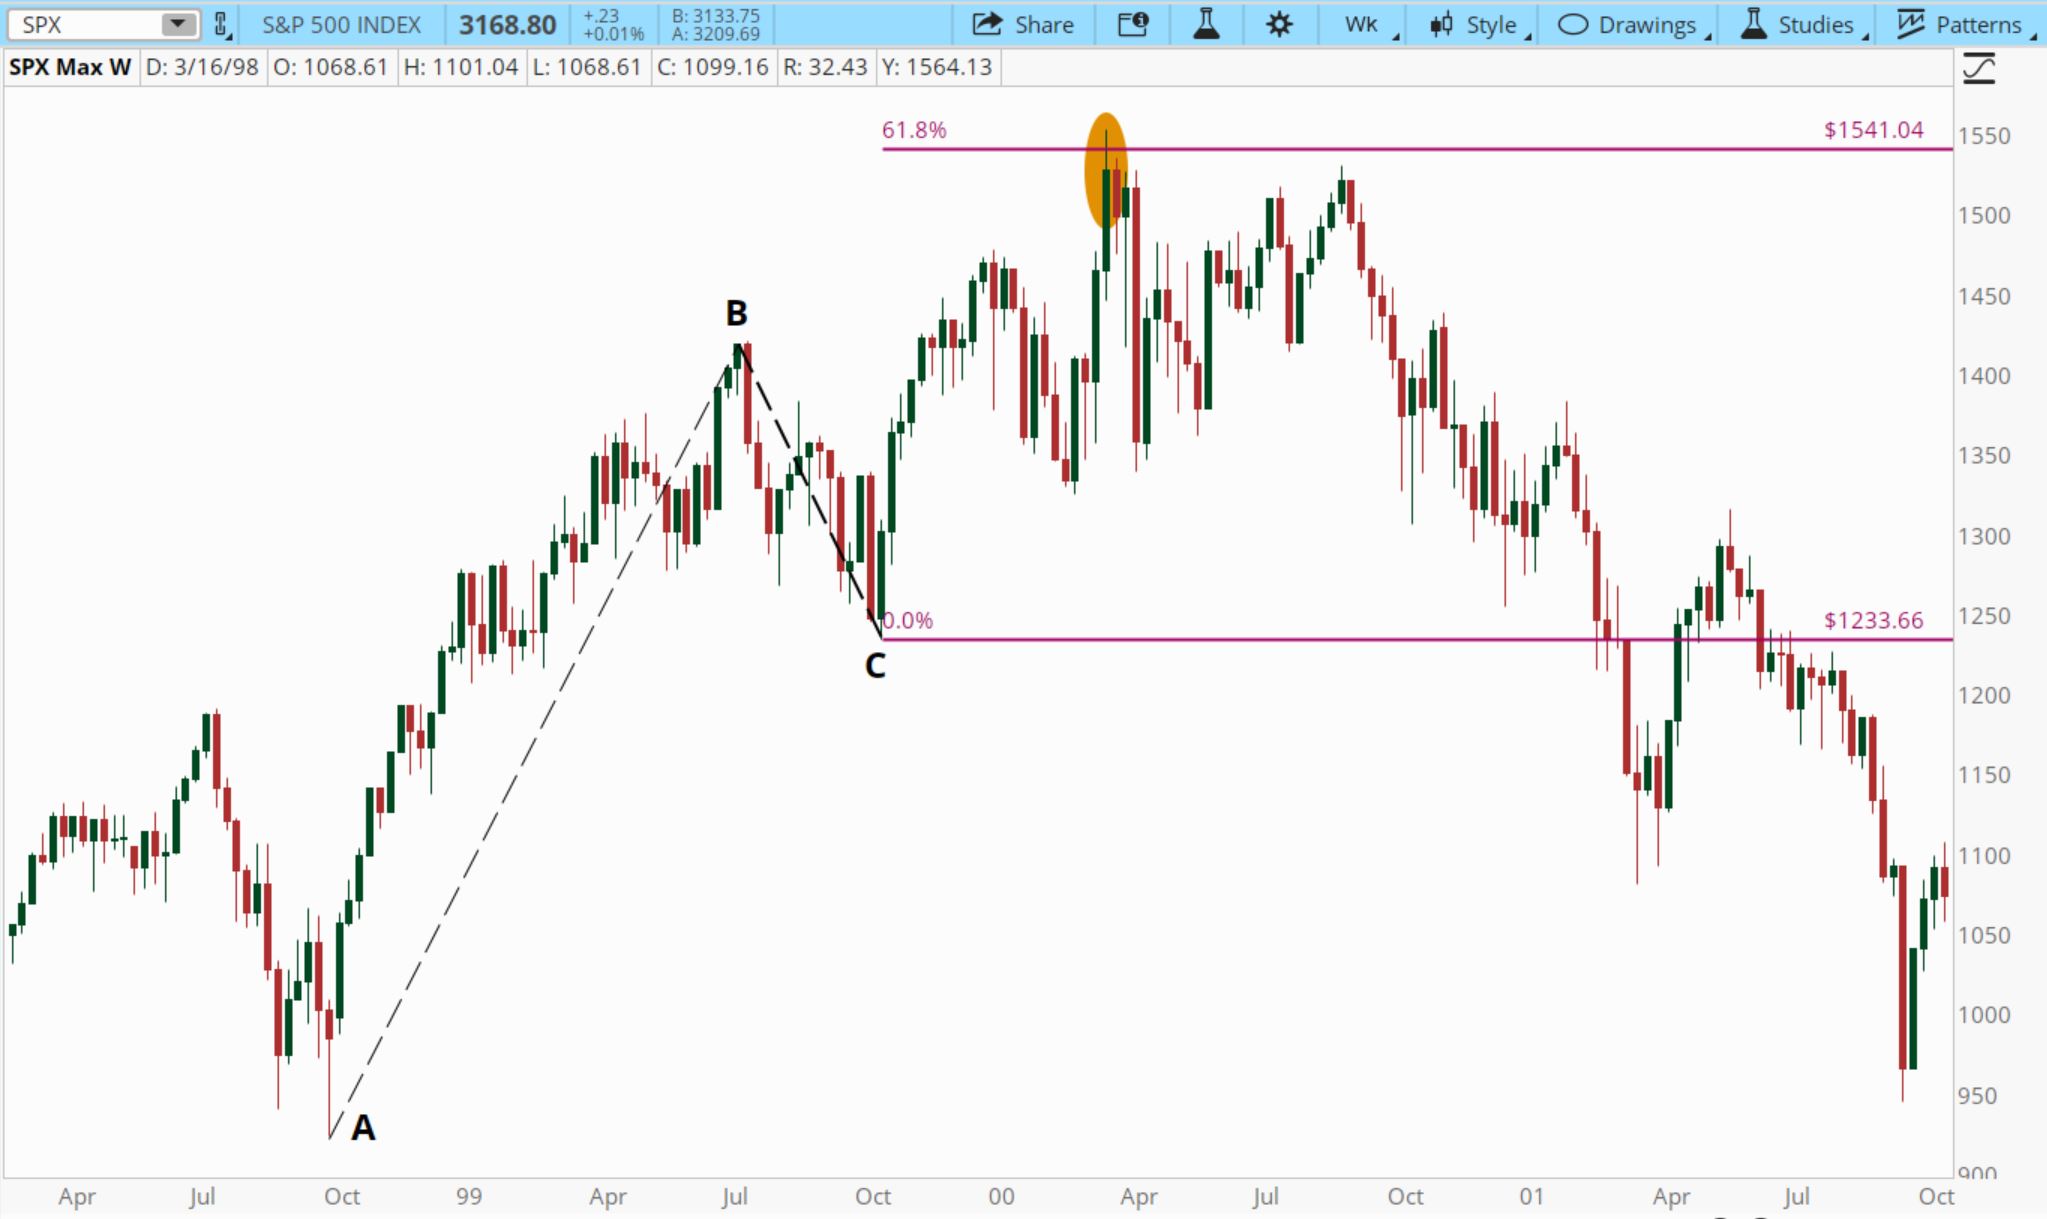
So, we can apply the Fibonacci Extension tool to the large time frame chart or the markets and estimate where we will see the trend reverse. Looking at the market highs in 1999 and 2007, the Fibonacci Extensions predicted the turning points for both peaks at a 61.8% extension.
So whichever strategy you select for timing the top of the markets, be sure to exercise risk management. There are losses possible in the markets but with the proper knowledge and skill, most can navigate them properly. The markets will eventually turn down; learn the skills you need to properly identify when and where they will do this.
I will be monitoring the broad markets and applying these techniques to anticipate the market turns just as I did in 2007 and 1999. To see more of my analysis, you can follow me on Twitter: @traderbdub. Of course, more training and skill building is available at your local Online Trading Academy center.
I want to wish everyone a happy holiday and prosperous new year! See you in 2020!
Neither Freedom Management Partners nor any of its personnel are registered broker-dealers or investment advisers. I will mention that I consider certain securities or positions to be good candidates for the types of strategies we are discussing or illustrating. Because I consider the securities or positions appropriate to the discussion or for illustration purposes does not mean that I am telling you to trade the strategies or securities. Keep in mind that we are not providing you with recommendations or personalized advice about your trading activities. The information we are providing is not tailored to any individual. Any mention of a particular security is not a recommendation to buy, sell, or hold that or any other security or a suggestion that it is suitable for any specific person. Keep in mind that all trading involves a risk of loss, and this will always be the situation, regardless of whether we are discussing strategies that are intended to limit risk. Also, Freedom Management Partners’ personnel are not subject to trading restrictions. I and others at Freedom Management Partners could have a position in a security or initiate a position in a security at any time.
Editors’ Picks

EUR/USD climbs to daily highs on US CPI
EUR/USD now accelerates it rebound and flirts with the 1.1880 zone on Friday, or daily highs, all in response to renewed selling pressure on the US Dollar. In the meantime, US inflation figures showed the headline CPI rose less than expected in January, removing some tailwinds from the Greenback’s momentum.

GBP/USD clings to gains above 1.3600
GBP/USD reverses three consecutive daily pullbacks on Friday, hovering around the low-1.3600s on the back of the vacillating performance of the Greenback in the wake of the release of US CPI prints in January. Earlier in the day, the BoE’s Pill suggested that UK inflation could settle around 2.5%, above the bank’s goal.

USD/JPY edges up above 153.50 with all eyes on US CPI figures
USD/JPY appreciates above 153.00 but remains on track for a 2.4% weekly loss. Trading volumes remain subdued on Friday, ahead of the IS CPI release. The Yen remains supported by hopes of a stable government and calls for further BoJ tightening.
Editors’ Picks
EUR/USD climbs to daily highs on US CPI
EUR/USD now accelerates it rebound and flirts with the 1.1880 zone on Friday, or daily highs, all in response to renewed selling pressure on the US Dollar. In the meantime, US inflation figures showed the headline CPI rose less than expected in January, removing some tailwinds from the Greenback’s momentum.
GBP/USD clings to gains above 1.3600
GBP/USD reverses three consecutive daily pullbacks on Friday, hovering around the low-1.3600s on the back of the vacillating performance of the Greenback in the wake of the release of US CPI prints in January. Earlier in the day, the BoE’s Pill suggested that UK inflation could settle around 2.5%, above the bank’s goal.

Gold: Upside remains capped by $5,000
Gold is reclaiming part of the ground lost on Wednesday’s marked retracement, as bargain-hunters seem to have stepped in. The precious metal’s upside, however, appears limited amid the slightly better tone in the US Dollar after US inflation data saw the CPI rise less than estimated at the beginning of the year.

Crypto Today: Bitcoin, Ethereum, XRP in choppy price action, weighed down by falling institutional interest
Bitcoin's upside remains largely constrained amid weak technicals and declining institutional interest. Ethereum trades sideways above $1,900 support with the upside capped below $2,000 amid ETF outflows.

Week ahead – Data blitz, Fed Minutes and RBNZ decision in the spotlight
US GDP and PCE inflation are main highlights, plus the Fed minutes. UK and Japan have busy calendars too with focus on CPI. Flash PMIs for February will also be doing the rounds. RBNZ meets, is unlikely to follow RBA’s hawkish path.
RECOMMENDED LESSONS
Making money in forex is easy if you know how the bankers trade!
I’m often mystified in my educational forex articles why so many traders struggle to make consistent money out of forex trading. The answer has more to do with what they don’t know than what they do know. After working in investment banks for 20 years many of which were as a Chief trader its second knowledge how to extract cash out of the market.
5 Forex News Events You Need To Know
In the fast moving world of currency markets where huge moves can seemingly come from nowhere, it is extremely important for new traders to learn about the various economic indicators and forex news events and releases that shape the markets. Indeed, quickly getting a handle on which data to look out for, what it means, and how to trade it can see new traders quickly become far more profitable and sets up the road to long term success.
Top 10 Chart Patterns Every Trader Should Know
Chart patterns are one of the most effective trading tools for a trader. They are pure price-action, and form on the basis of underlying buying and selling pressure. Chart patterns have a proven track-record, and traders use them to identify continuation or reversal signals, to open positions and identify price targets.
7 Ways to Avoid Forex Scams
The forex industry is recently seeing more and more scams. Here are 7 ways to avoid losing your money in such scams: Forex scams are becoming frequent. Michael Greenberg reports on luxurious expenses, including a submarine bought from the money taken from forex traders. Here’s another report of a forex fraud. So, how can we avoid falling in such forex scams?
What Are the 10 Fatal Mistakes Traders Make
Trading is exciting. Trading is hard. Trading is extremely hard. Some say that it takes more than 10,000 hours to master. Others believe that trading is the way to quick riches. They might be both wrong. What is important to know that no matter how experienced you are, mistakes will be part of the trading process.
The challenge: Timing the market and trader psychology
Successful trading often comes down to timing – entering and exiting trades at the right moments. Yet timing the market is notoriously difficult, largely because human psychology can derail even the best plans. Two powerful emotions in particular – fear and greed – tend to drive trading decisions off course.