The Trend is Your Friend, Until it Ends

Market trends are critical to our investment framework. In fact, if we were forced to choose only one component of our process and lose the rest, we would choose market trends. The reason is because it gives us the clearest picture of what the markets are doing right now , in the present moment. We can use this information to form an immediate opinion about any market regardless of fundamental knowledge. That is the beauty of this component of our framework. We can take a position simply because, at that moment, it is going up or down. As trend followers at heart, we want to buy what is going up and sell what is going down. We don't need to understand the industry, to be familiar with the competitive landscape, to listen to conference calls, or to pour through annual reports. All we need is price, and price is really all that matters.
Think about this for a minute. If we get all the fundamental data and that information tells us that a certain stock is a solid company, has plenty of assets on the balance sheet, and is of value, what would make that a worthwhile investment? If the price went up, right? The price going up is what confirms that our fundamental work is correct. That is why price is so important. We are not saying that fundamental analysis is useless. In fact, we believe in combining both fundamental and quantitative trend analysis. What we are saying is that we believe trends are important and should be paid attention to when making investment decisions.
When looking at broad markets across the world, it is easy to see that trends are negative in a majority of the asset classes we follow. We also see that certain factors are starting to break out to positive trends, while others are breaking down. This offers us clues as to the environment we are in, presenting potential opportunities.
A good way to measure long -term trends is to examine broad markets relative to their 10 month moving average. This is essentially a monthly version of the 200 day moving average and a good barometer of the long -term trend in a particular market. In the charts throughout this week's commentary, we will examine global stocks, commodities, bonds, gold, the US dollar and some important factor ETFs to draw insights on the state of asset markets. The broad swath of negative trends are indicative of an environment where cash is king. It is one of uncertainty and potential regime change.
The MSCI World Ex -US stock market index, which contains both developed and emerging markets are in a confirmed negative trend. This index broke down earlier in the year and did not recover with the US markets from March through September. Instead, global stocks consolidated before breaking down further. If you are following the trend, you would be a seller of global equities. We believe this is indicative of an environment where global growth is slowing.
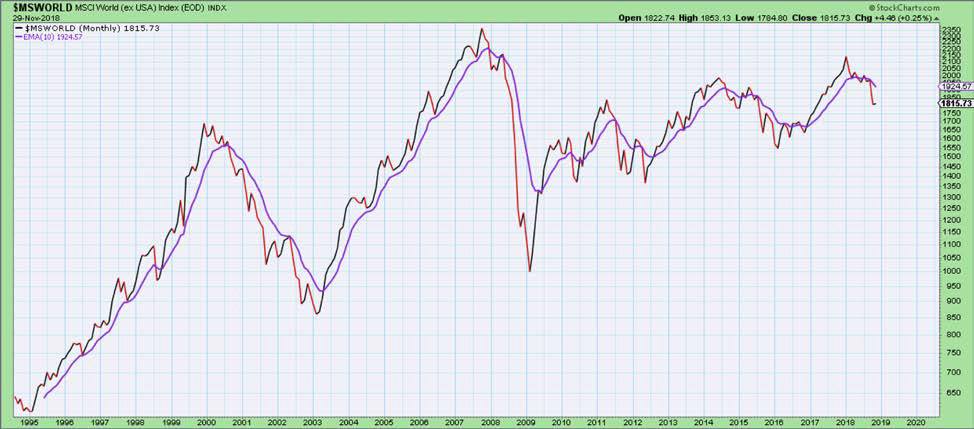
Chart 1: MSCI World ex US Index versus 10 month exponential moving average
The Wilshire 5000 index in the US is also below its 10 month moving average. This is the first negative breakdown for US stocks since the 2015- 2016 global correction. The negative trend in US stocks suggests to us that the investment environment in US stocks is not attractive at the moment. Despite the rally this week, the US stock market is still below trend and looks to close another month below the 10 month moving average. We take this as a sign that growth in the US is slowing.
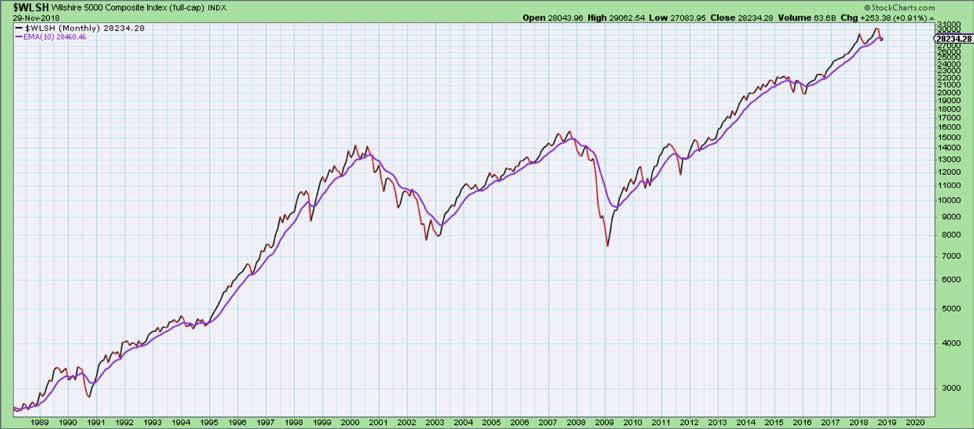
Chart 2: Wilshire 5000 US stock index versus 10 month exponential moving average .
Commodities, as illustrated using the CRB index, is also in a negative trend relative to its 10 month moving average. The negative trend in commodities is indicative of slowing inflation expectations and slowing global growth. Commodities tend to trend positively when global growth is moving up along with inflation expectations. This was the case earlier in the year. However, commodities prices peaked along with global growth expectations and have since declined significantly. Oil prices are down 30% since their peak and 21% this month.
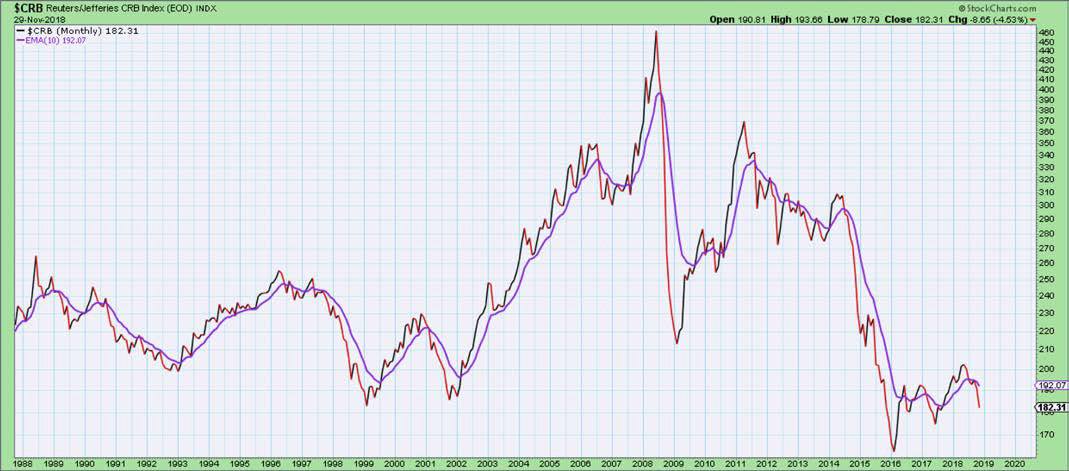
Chart 3: Commodities versus its 10 month moving average.
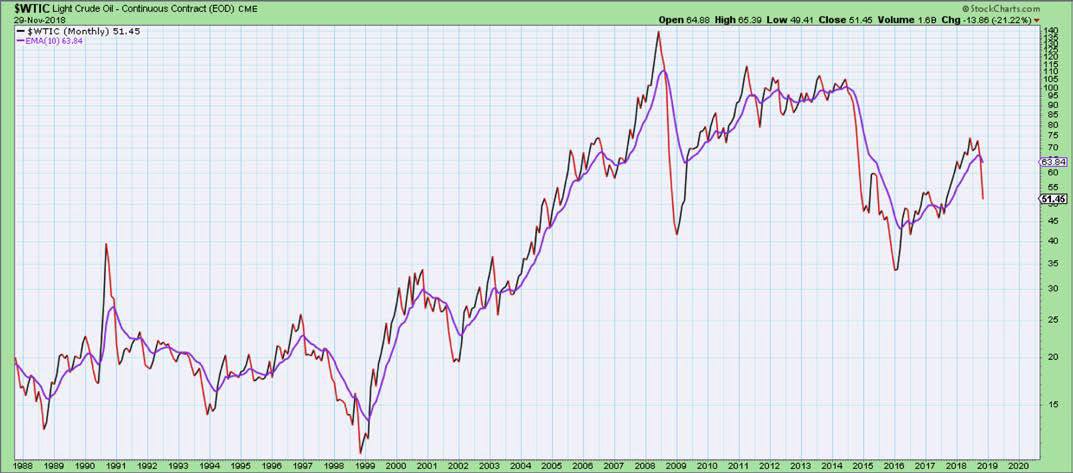
Chart 4: West Texas Crude versus its 10 month moving average.
Bonds are in a negative trend too long -term. The US 10 Year yield is above its 10 month moving average indicating the negative trend in bond prices (yields move inversely to price). Although bonds have had a bit of a bounce over the last month, they have yet to signal a positive trend. The 10 year yield would have to break below 2.90% from 3.03%. If bonds break out into a positive trend (rates in a negative trend), we would think this could mean further risk aversion in global stock and commodities markets.
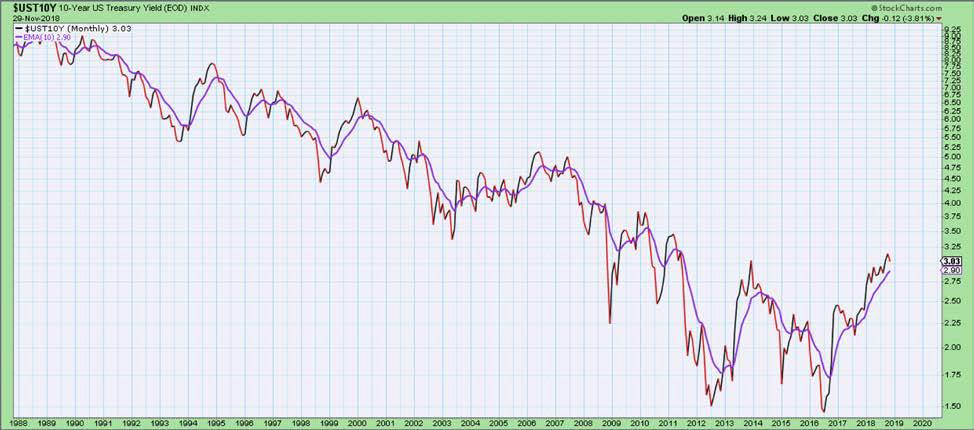
Chart 5: US 10 year interest rates versus its 10 month moving average .
Gold is in a negative trend as well, still below its 10 month moving average. Gold is currently $1224 per ounce. Its 10 month moving average is $1244.39 per ounce. The negative trend in Gold is interesting given the deflationary pulse we are witnessing in the markets. The fact that the Fed is tilting more dovish in its communication would make one think that Gold, a historical store of value and defensive asset, would rally in response. However, it has failed to turn into a positive trend.

Chart 6: Gold versus its 10 month moving average.
The only asset class that we follow that is in a positive trend right now is the US dollar or cash. The US dollar is above its 10 month moving average and has rallied throughout 2018 after falling in 2017. This implies falling inflation expectations and creates a bit of a deflationary pulse across risky asset classes. In addition the rally in the dollar creates margin compression and should slow earnings.
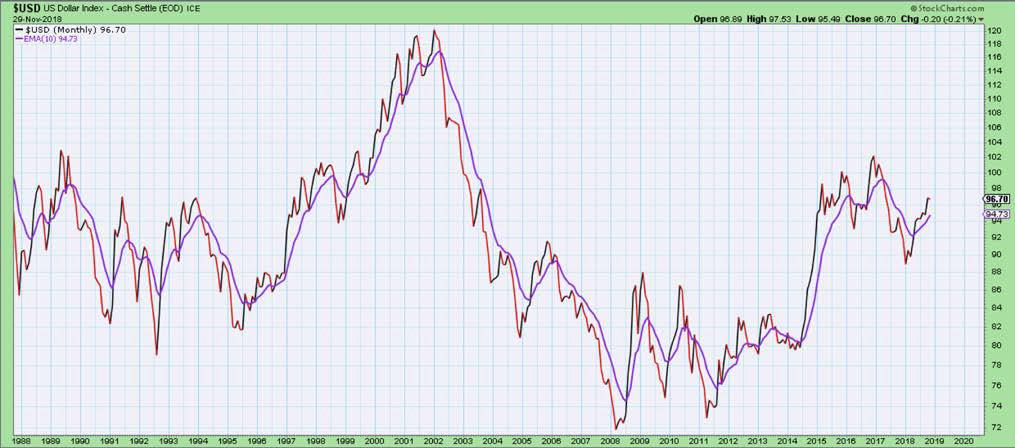
Chart 7: The US Dollar versus its 10 month moving average.
By studying factor and sub asset class exposures in equities and fixed income markets, we can also learn valuable information about the current environment or regime. For instance, the momentum factor ETF (MTUM) recently broke below its 10 month moving average signaling a reversal into a negative trend. This is a departure from the positive trend that characterized this factors leadership since early 2016.
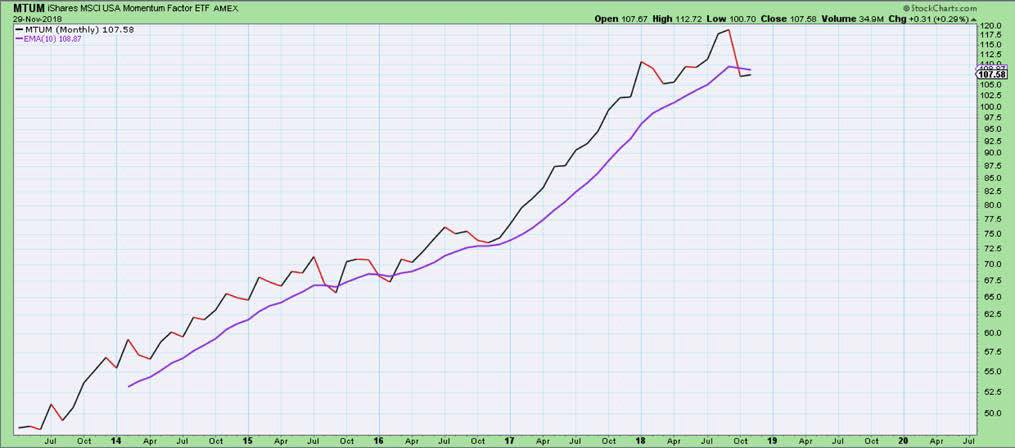
Chart 8: Momentum factor ETF versus its 10 month moving average .
On the contrary, the low volatility factor is holding its positive trend and even breaking out to new highs (SPLV). This is a sign of continued strength and improving relative strength as opposed to the weakening of the momentum factor. This provides valuable information as it relates to the current regime and suggests that lower volatility is potentially a better factor overweight versus momentum.
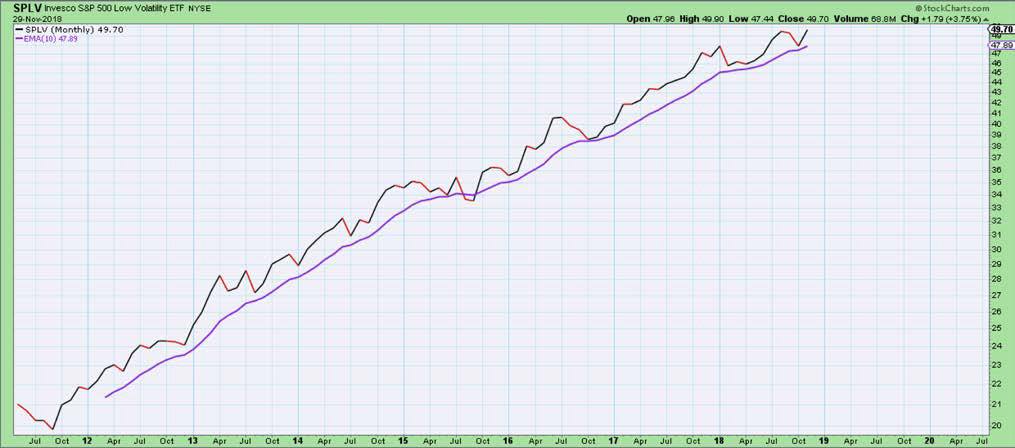
Chart 9: S&P Low Volatility ETF (SPLV) versus its 10 month moving average.
Just by looking at trends we can ascertain the current situation in growth, inflation, and market sentiment. This can all be done by simply following the trends. The fact that the US dollar is the only broad market in a positive trend suggests that cash is the proper allocation given the current environment. It tells us that US growth and inflation are slowing and we know that means trouble for certain factors and styles, such as momentum and growth. However, we also know that slowing growth and inflation could mean positive things for bonds, low volatility stocks, and value equities.
We don't need to know when the Fed will stop hiking rates or whether or not President Trump and Xi Jinping will agree on a trade deal. We don't need to know whether or not the global economy will even slip into a recession. In order to make good portfolio decisions, all we really need to know is whether or not the markets we are investing in are in positive trends or negative trends. One thing we have learned is that price trends matter and investing with the trend is the way to go.
Author

Clint Sorenson, CFA, CMT
WealthShield
Managing Partner of Emerald Investment Partners, LLC and Co-Founder of WealthShield, Clint has long been dedicated to innovating and accelerating the investment landscape.


