Swing trading with the help of Bollinger Band and ADX
/stock-market-graph-gm531397401-55485034.jpg)
Traders indulge into various kind of trading: positional trading, intraday-day trading, scalping, swing trading, etc. Where positional trading is of longer duration, the rest of them are of shorter duration ranging from a day to just couple of minutes to take the required benefits. In order to get the optimum gains they depend on various technical indicators which help them to forecast movement on the basis of given price chart. In the following article you’ll find how a trader can benefit from two basic indicators namely, Bollinger band and ADX in order to get required benefits from swing trading.
Swing trading is a type of trading wherein investors look for quick gains. It is very similar to day trading wherein investors don’t hold their positions with long term scenario. It may be for an hour, a day or couple of days that a swing trader is looking for. Given the opportunities provided by market movement, swing traders enter and exit the market in the same day or may be couple of hours. Hence, in order to capitalize the market moves we should know such indicators which help gain the required return as soon as possible. Bollinger band and ADX (Average Directional Movement Index) are two such technical indicators which help benefit from price swings. Let’s understand them in detail.
Bollinger band: Bollinger band is a widely known technical indicator for swing trading as it indicates the probable turnaround in prices. It consists of three curves which are drawn with the help of moving average and standard deviations. The middle band is a moving average of a definite period, where as the upper and lower bands are standard deviations of the middle line. Generally, Middle band is made up of 20 day moving average while upper and lower band are at 2 standard deviations of the middle band.
Usage: When an underlying moves outside the upper Bollinger band, it is considered "overbought" indicating probable profit booking and price liquidation. Conversely, when an underlying trades below the lower Bollinger band, it is considered “oversold” and indicates prices to cover the losses. In case the underlying quote has moved up from the lower band, then middle band would be the first resistance while sustained trading above middle band would lead the quote towards upper band. In case of quote moving down from the upper band the first support would be middle band, if it fails to sustain that support; lower band would be the next level to watch.
ADX (Average Directional Movement Index or Average Directional Index): While Bollinger band indicates a probable turn around, ADX indicates the strength of the existing price move. ADX is exponential moving average of Directional Index (DX) for a specified period of time. Directional Index is made up of two indicators, namely, positive directional indicator (+DI) and negative directional indicator (–DI). The +DI calculates the strength of upward move while the –DI calculates the strength of downward move. Both of them are being plotted with the ADX in the indicator window between a bounded range of zero and 100. The standard time period used in this indicator is 14 periods. Usage: When the ADX is above 40 level, prevailing trend is considered to be a strong one while in case of ADX trading below 20 level, it indicates a weaker trend. In other words, as far as the ADX line trades above 40 level with upward trend, it indicates continuance of the prevailing trend (Be it Bullish or Bearish) while a down ward turn below 40 level would indicate a probable change in trend. In a same way, if the ADX line is trading below 20 level and showing the sign of increase, the prevailing trend is expected to gain momentum.
In the following article you’ll learn how Bollinger Band and ADX (Average Directional Movement Index) would help in swing trading.
Strategy: If the underlying quote is testing upper or lower band of Bollinger, it is expected to reverse, the strength of reversal can be known with the present level and trend of ADX.
Example 1: If the quote is trading above upper band of Bollinger, look for the ADX if it is ranging downward towards below 40 level then selling pressure is expected with the targets of middle band and then lower band of Bollinger.
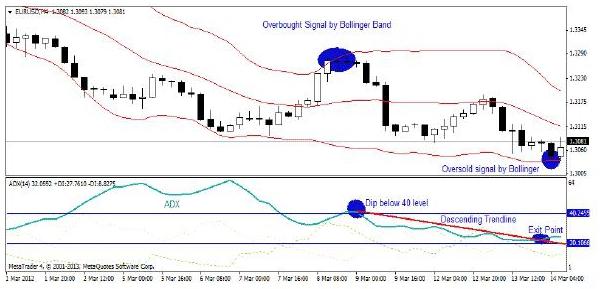
Four Hour Chart: Above mentioned four hourly chart of EURUSD describes how to trade with the help of Bollinger band and ADX. As we can see, the quote crossed the upper band of Bollinger closing above 1.3265, indicating overbought scenario and expectation of profit booking. At the lower panel, a dip below 40 level in ADX also signaled change in the prevailing buying. The trend reversal was supported with the descending trend line on ADX. The quote tested the lower band of Bollinger near 1.3030 indicating a probable turn around in prices. Hence, an investor should book full profits at 1.3030.
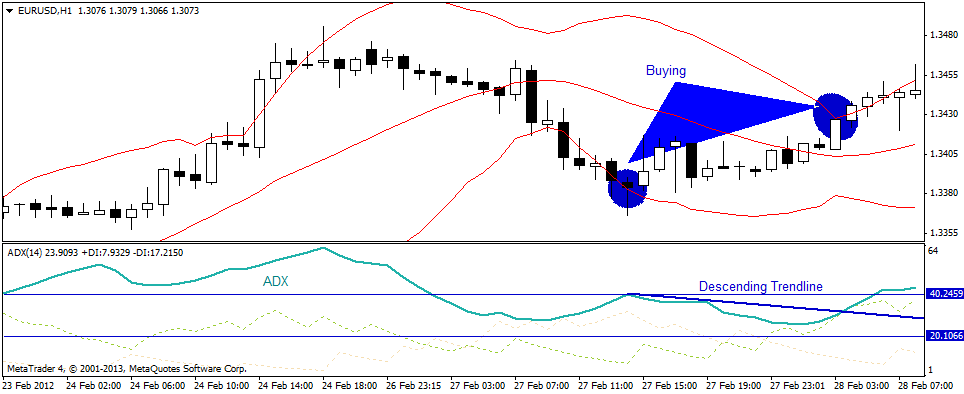
Hourly Chart: Above mentioned hourly chart of EURUSD gives another example of how to trade with the help of ADX and Bollinger band. The quotes traded below the lower band of Bollinger and ADX was also trending downwards indicating a probable trend reversal from the existing liquidation. Hence, by buying at the lower band of Bollinger and drawing a trend line, we should hold our position until the quote tests upper band of Bollinger. As per above mentioned strategy, by buying near 1.3390 and liquidating positions near 1.3430, we can make profits of 40 bps. Example 2: If the prices give breakout from the lower area of Bollinger (or upper area) with ADX ranging upwards from below 20 level, it is expected that prices will trade higher (lower) until the prices gave close above upper band of Bollinger (or below lower band of Bollinger) or the downtick in the ADX, whichever comes first.
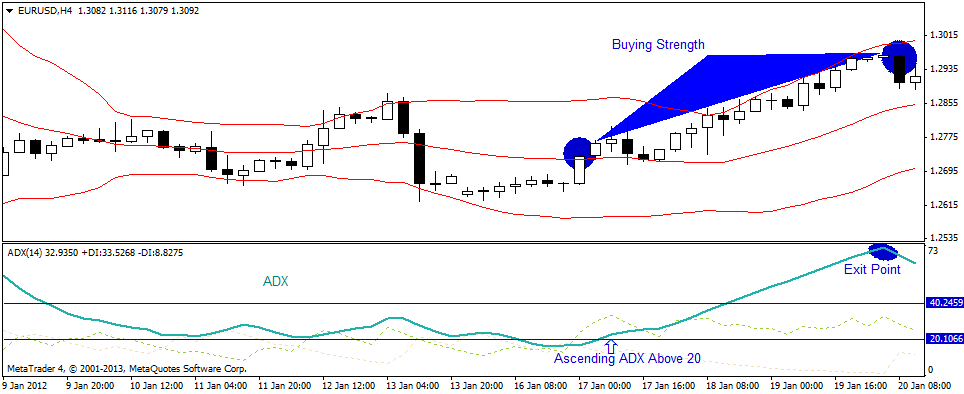
Four Hour Chart: Looking from above mentioned four hourly chart of EURUSD, it can be observed that sudden spurt in EURUSD quote breaking the normal range and forcing the quote to trade above 1.2730 level was well supported by ascending ADX above 20 level. One wouldargue that the quote have touched upper band of Bollinger many a time which should indicateselling, But it should be bear in mind that none of the time it has given a closing above Upper Bollinger Band, merely trading near the upper band would not indicate an overbought market.
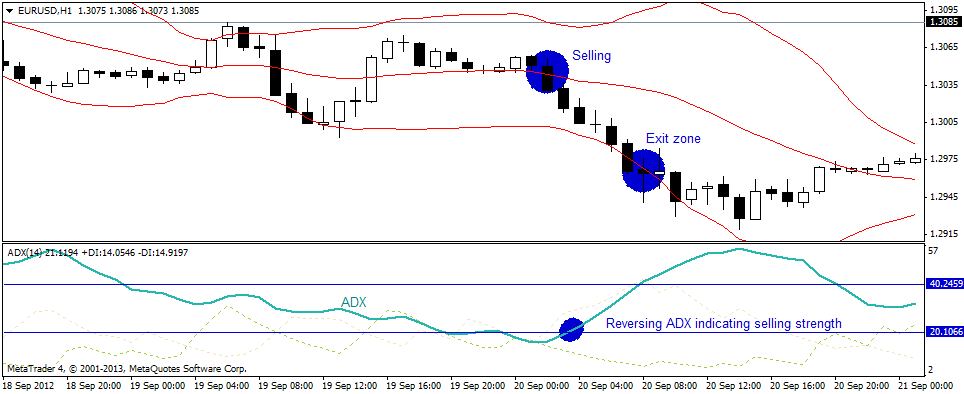
Hourly Chart: Above mentioned hourly chart of EURUSD gives another example of how to trade with the help of ADX and Bollinger band. As the prices were trading in range and sudden spurt of selling initiated, one should look for the ADX which is reversing from 20 level indicating the selling pressure has a strength and would continue. Taking sell position at that level one should have the target of a close below lower Bollinger band. In this example, 60 bps (the difference between 1.3030 and 1.2970) were the gains generated with the help of this strategy.
Rating: 3 out of 5 stars
Feedback: The strategy seems important from the swing trader’s point of view but the point of limitation is stop loss orders. The strategy is mute regarding the point of exit from the existing position in case of adverse price movement. Hence, in order to take due care, it is always expected to use certain other indicators which provide stop loss point in case of adverse price movement.
Author
FXStreet Team
FXStreet
Composed of a group of economic journalists and FX experts, the FXStreet content team produces and oversees all content published on FXStreet. It provides a purely journalistic approach to the Forex market.


