![]() Brandon Wendell, CMT
Brandon Wendell, CMT
Brandon Wendell
The markets and individual securities routinely fall into cycles that are measurable and predictable. Socioeconomic and market conditions may themselves change but the cycles still tend to prevail, especially for the duration of the trend. Traders who can identify both the cycle and the current location of price in that cycle are more likely to be successful in timing their entries and exits.
In traditional technical analysis there are a lot of long term established cycles that influence the broad markets. However, as traders, we want to focus on the shorter time frame cycles that will influence our securities while we are in positions.
A cycle is measured by the distance between lows. This is also referred to as the frequency of the cycle. In trader terms, the frequency will tell you when to expect lows or moves to the downside in price. Once you identify the stock’s cycle, you have a higher probability for trading in the right direction.
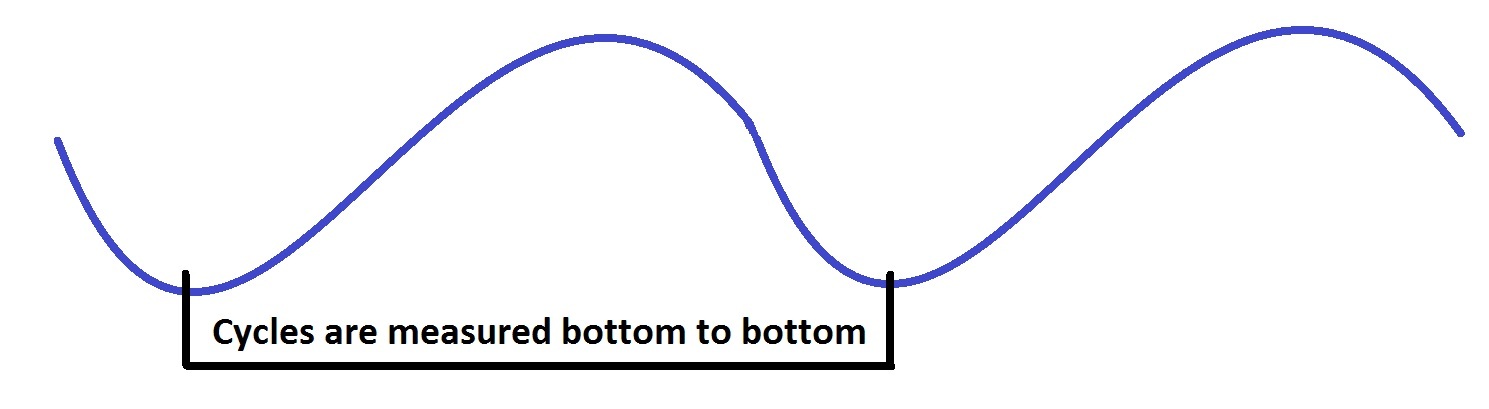
As I previously mentioned, cycles are measured from the lows. There is a cycle tool on some trading platforms that will allow you to line up vertical lines with the lows on your price chart. Don’t worry if the lines do not match every low, as there are multiple cycles affecting the price at any time. You want to locate the dominant one that you can trade with. That will be the one that contains the majority of the lows.
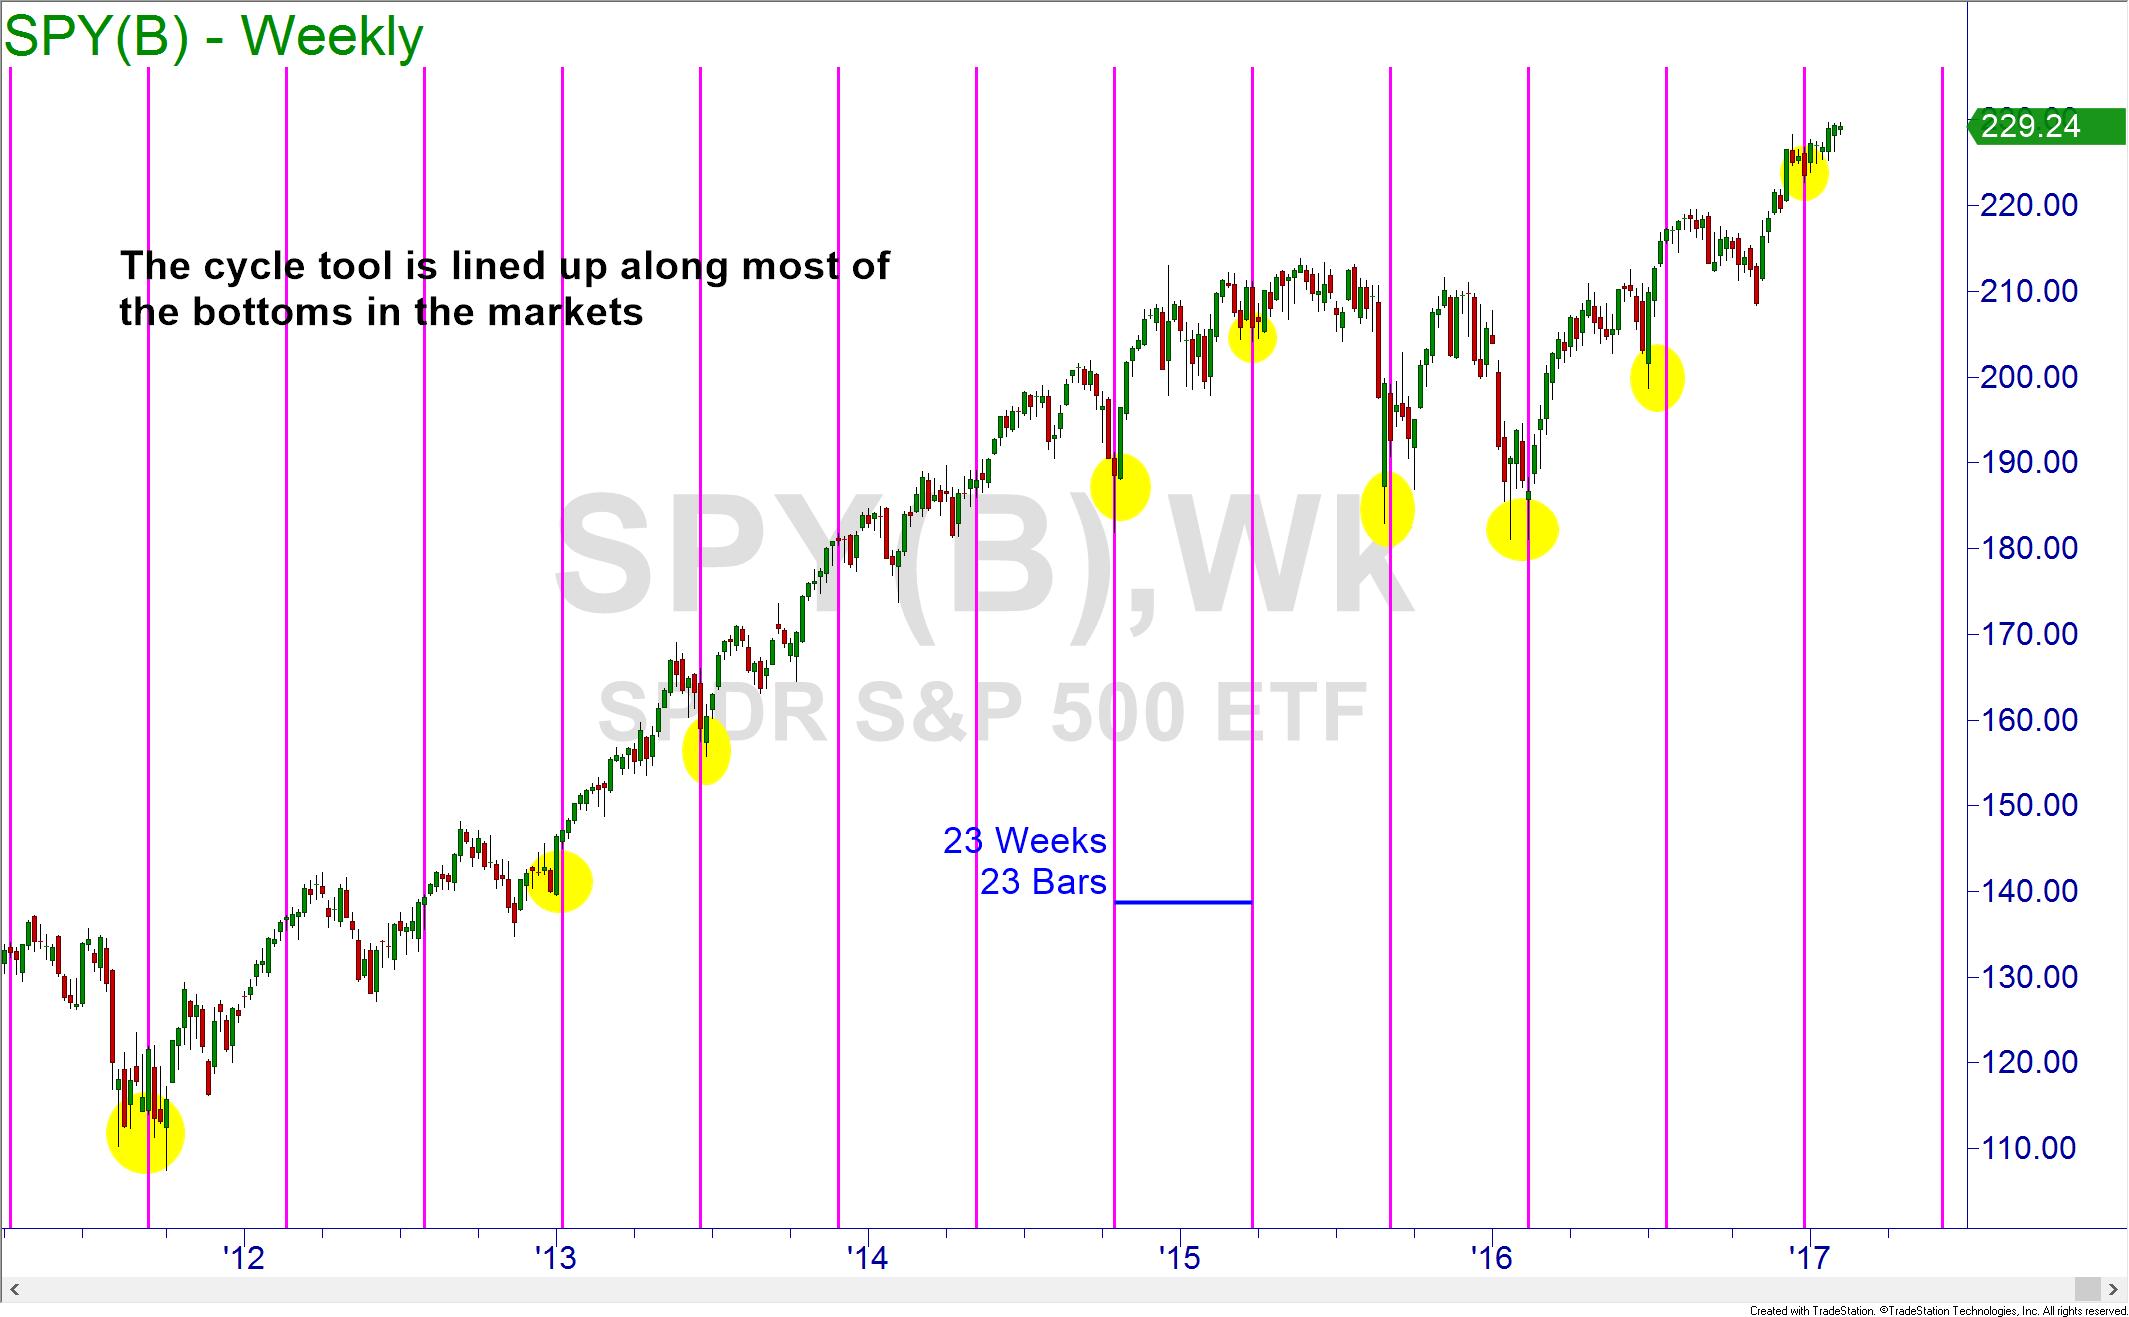
We can do this study on any stock and for any timeframe.
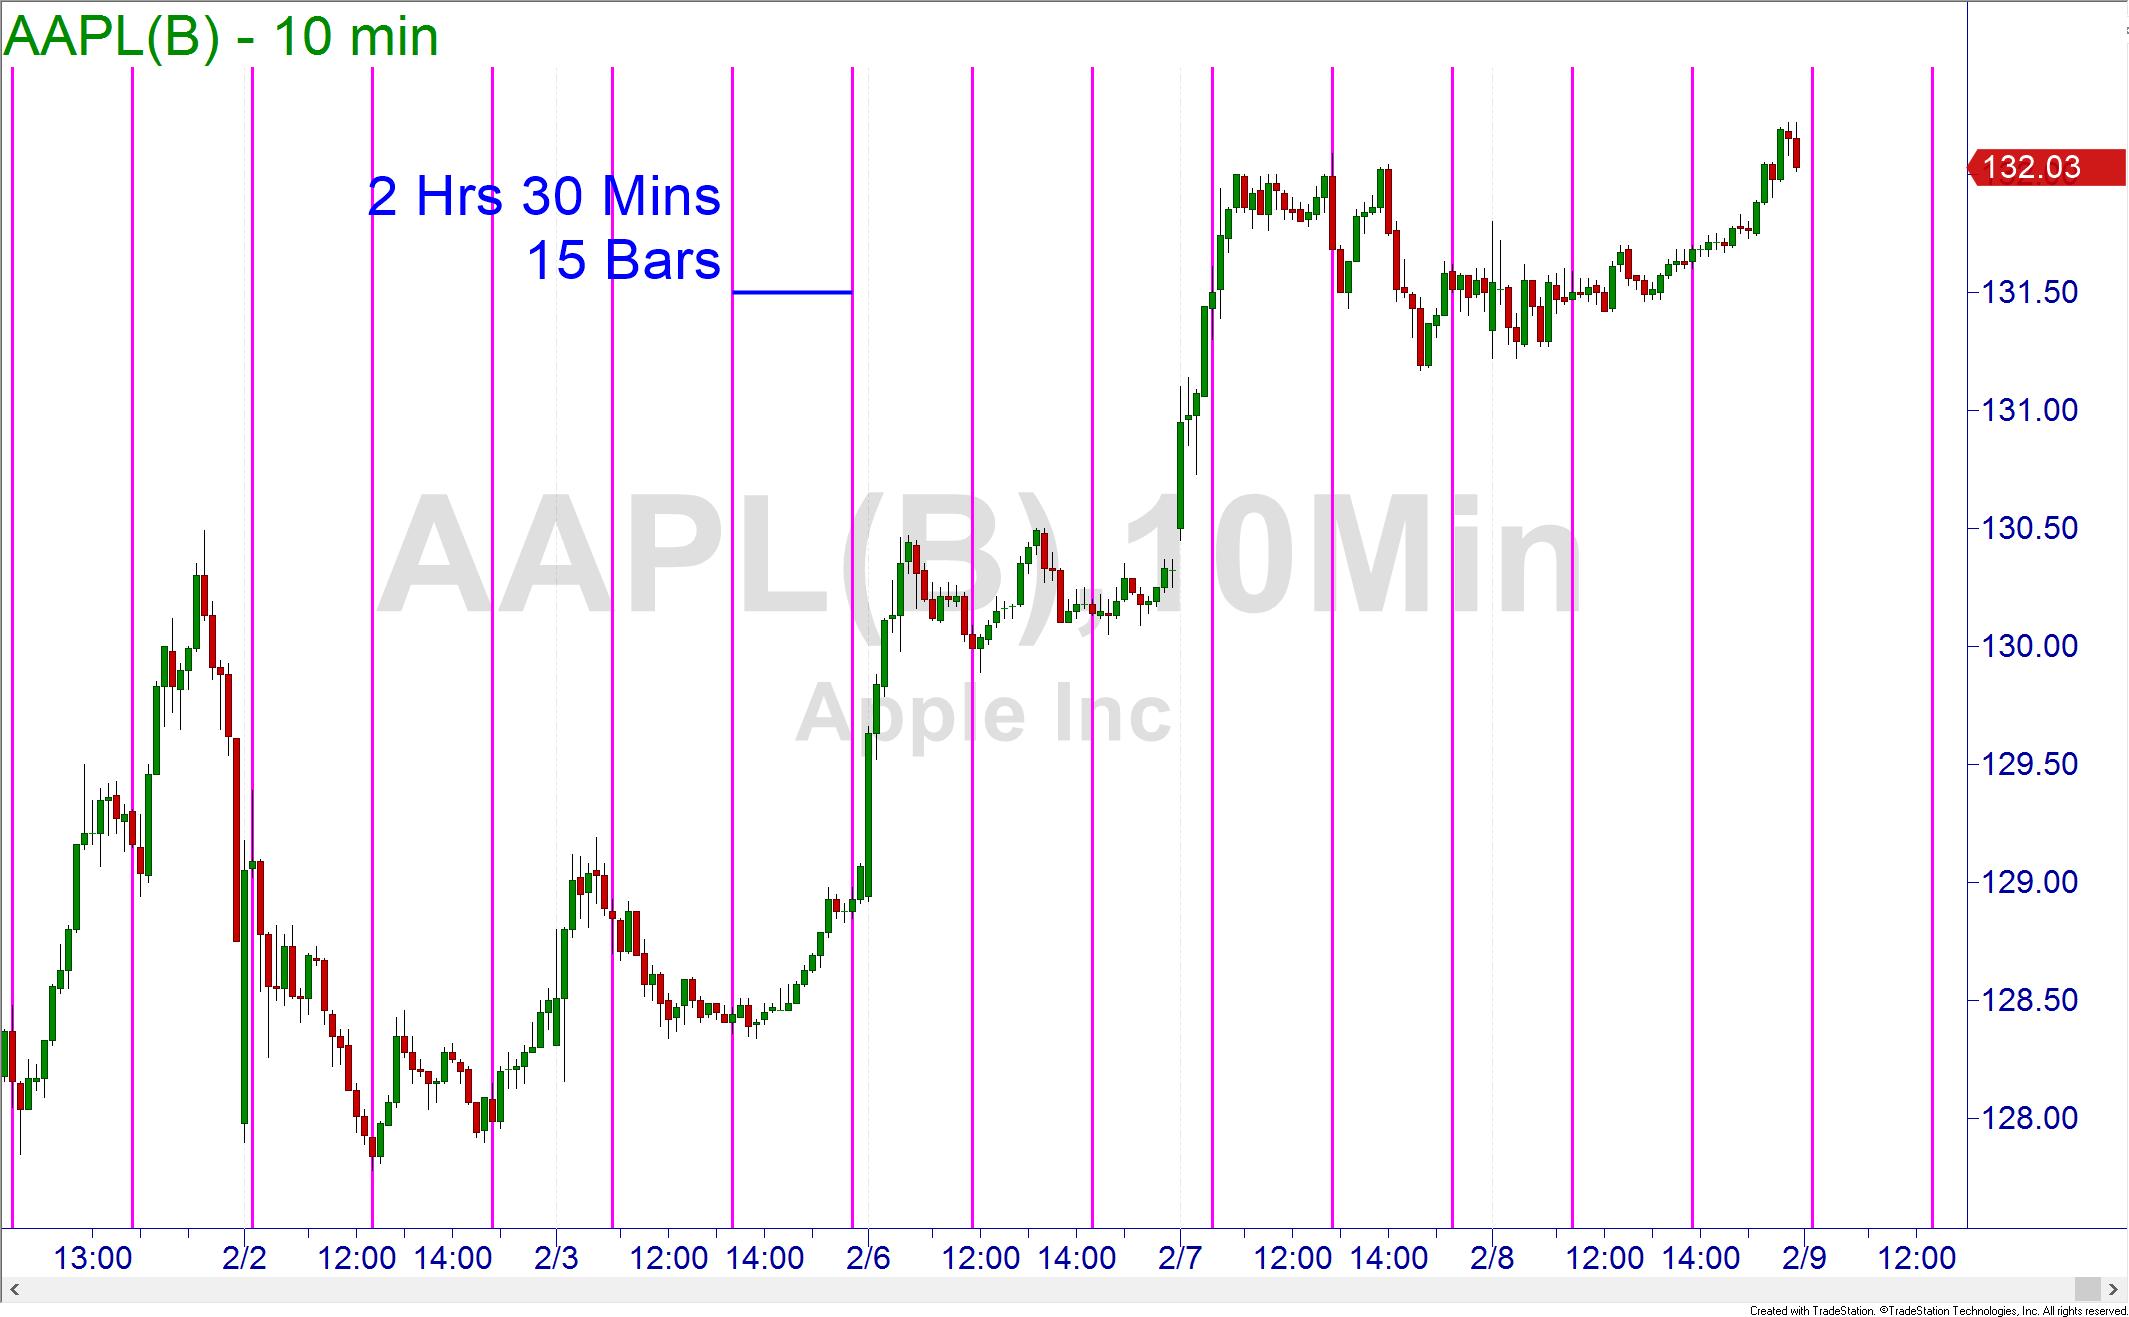
The cycles will be more stable on longer term charts, but knowing the cycle can assist you in your trading. If you see price approaching a supply or demand level but the cycle is not indicating a top or bottom, the level may have a higher probability of breaking. But if the cycle top or bottom is near, the levels are more likely to hold.
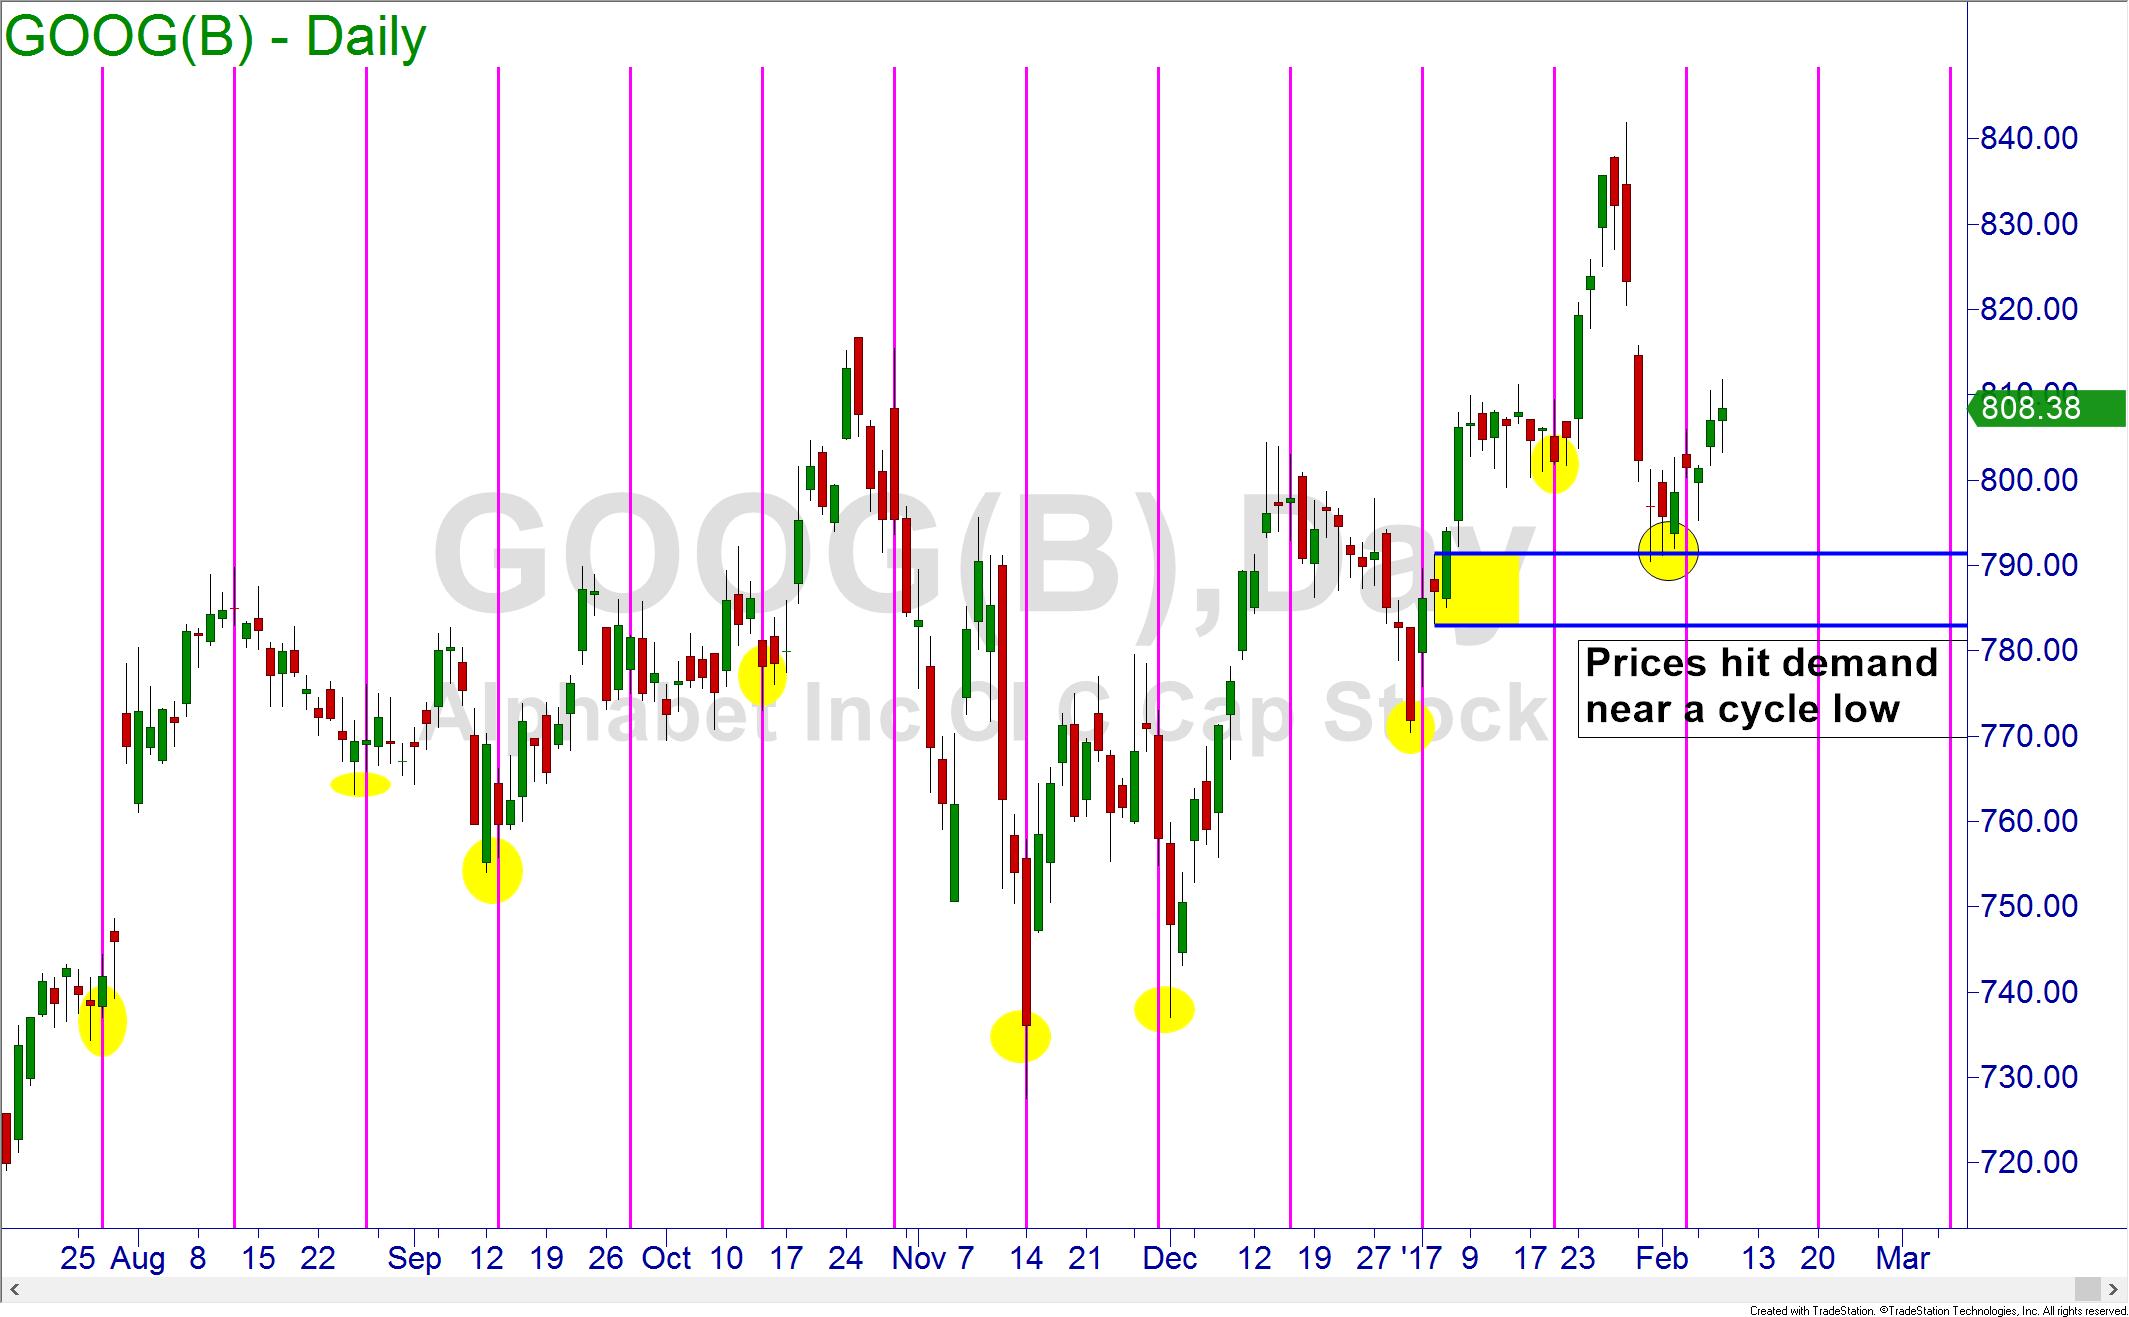
Online Trading Academy’s Core Strategy partly relies on using multiple time frames for proper analysis. When we look at the higher timeframes, the cycle lends itself to assist the trader in deciding which direction they should trade in. When the trader then drops down to a lower timeframe to identify entries and exits, the cycle can be used as an odds enhancer for seeing whether the demand and supply zones are more or less likely to hold.
If the trading platform you use does not have the cycle tool, you can still easily locate the cycle of your security. Start by marking the lows and then count the number of candles in between those lows. They should be relatively similar. You can then take the average between those lows as your stock’s or market’s cycle.
So while it is not a perfect indicator, (there is no perfect indicator, decisions should be made from price) the cycle of a security can be a good odds enhancer when you are trading. To greatly improve your chances for success in trading the markets, visit your local Online Trading Academy Center today and enroll in a course.
Neither Freedom Management Partners nor any of its personnel are registered broker-dealers or investment advisers. I will mention that I consider certain securities or positions to be good candidates for the types of strategies we are discussing or illustrating. Because I consider the securities or positions appropriate to the discussion or for illustration purposes does not mean that I am telling you to trade the strategies or securities. Keep in mind that we are not providing you with recommendations or personalized advice about your trading activities. The information we are providing is not tailored to any individual. Any mention of a particular security is not a recommendation to buy, sell, or hold that or any other security or a suggestion that it is suitable for any specific person. Keep in mind that all trading involves a risk of loss, and this will always be the situation, regardless of whether we are discussing strategies that are intended to limit risk. Also, Freedom Management Partners’ personnel are not subject to trading restrictions. I and others at Freedom Management Partners could have a position in a security or initiate a position in a security at any time.
Editors’ Picks

EUR/USD hits two-day highs near 1.1820
EUR/USD picks up pace and reaches two-day tops around 1.1820 at the end of the week. The pair’s move higher comes on the back of renewed weakness in the US Dollar amid growing talk that the Fed could deliver an interest rate cut as early as March. On the docket, the flash US Consumer Sentiment improves to 57.3 in February.

GBP/USD reclaims 1.3600 and above
GBP/USD reverses two straight days of losses, surpassing the key 1.3600 yardstick on Friday. Cable’s rebound comes as the Greenback slips away from two-week highs in response to some profit-taking mood and speculation of Fed rate cuts. In addition, hawkish comments from the BoE’s Pill are also collaborating with the quid’s improvement.

USD/JPY drops back below 157.00, as focus shifts to Japan snap election
USD/JPY is back in the red below 157.00 in the Asian session on Friday. The Japanese Yen recovers ground against the US Dollar amid some profit-taking ahead of Japan's snap general election on Sunday. The preliminary reading of the Michigan Consumer Sentiment Index report for February will be released later on Friday.
Editors’ Picks

EUR/USD: US Dollar to remain pressured until uncertainty fog dissipates Premium
The EUR/USD pair lost additional ground in the first week of February, settling at around 1.1820. The reversal lost momentum after the pair peaked at 1.2082 in January, its highest since mid-2021.

Gold: Volatility persists in commodity space Premium
After losing more than 8% to end the previous week, Gold (XAU/USD) remained under heavy selling pressure on Monday and dropped toward $4,400. Although XAU/USD staged a decisive rebound afterward, it failed to stabilize above $5,000.

GBP/USD: Pound Sterling tests key support ahead of a big week Premium
The Pound Sterling (GBP) changed course against the US Dollar (USD), with GBP/USD giving up nearly 200 pips in a dramatic correction.

Bitcoin: The worst may be behind us
Bitcoin (BTC) price recovers slightly, trading at $65,000 at the time of writing on Friday, after reaching a low of $60,000 during the early Asian trading session. The Crypto King remained under pressure so far this week, posting three consecutive weeks of losses exceeding 30%.

Three scenarios for Japanese Yen ahead of snap election Premium
The latest polls point to a dominant win for the ruling bloc at the upcoming Japanese snap election. The larger Sanae Takaichi’s mandate, the more investors fear faster implementation of tax cuts and spending plans.
RECOMMENDED LESSONS
Making money in forex is easy if you know how the bankers trade!
I’m often mystified in my educational forex articles why so many traders struggle to make consistent money out of forex trading. The answer has more to do with what they don’t know than what they do know. After working in investment banks for 20 years many of which were as a Chief trader its second knowledge how to extract cash out of the market.
5 Forex News Events You Need To Know
In the fast moving world of currency markets where huge moves can seemingly come from nowhere, it is extremely important for new traders to learn about the various economic indicators and forex news events and releases that shape the markets. Indeed, quickly getting a handle on which data to look out for, what it means, and how to trade it can see new traders quickly become far more profitable and sets up the road to long term success.
Top 10 Chart Patterns Every Trader Should Know
Chart patterns are one of the most effective trading tools for a trader. They are pure price-action, and form on the basis of underlying buying and selling pressure. Chart patterns have a proven track-record, and traders use them to identify continuation or reversal signals, to open positions and identify price targets.
7 Ways to Avoid Forex Scams
The forex industry is recently seeing more and more scams. Here are 7 ways to avoid losing your money in such scams: Forex scams are becoming frequent. Michael Greenberg reports on luxurious expenses, including a submarine bought from the money taken from forex traders. Here’s another report of a forex fraud. So, how can we avoid falling in such forex scams?
What Are the 10 Fatal Mistakes Traders Make
Trading is exciting. Trading is hard. Trading is extremely hard. Some say that it takes more than 10,000 hours to master. Others believe that trading is the way to quick riches. They might be both wrong. What is important to know that no matter how experienced you are, mistakes will be part of the trading process.
The challenge: Timing the market and trader psychology
Successful trading often comes down to timing – entering and exiting trades at the right moments. Yet timing the market is notoriously difficult, largely because human psychology can derail even the best plans. Two powerful emotions in particular – fear and greed – tend to drive trading decisions off course.