![]() Sam Seiden
Sam Seiden
Independent Analyst
Over the years, I’ve been puzzled by conventional and mainstream trading education. Always, the focus is on the chart and volume. There are books written solely about candlesticks and others that deal only with volume because conventional wisdom says those two contain the most important pieces of the trading decision making process. If we step backwards for a moment and ask ourselves the basic question of how and why prices turn and move in markets, I think you will find that the conventional focus may be missing the most important ingredient.
The goal is to have a rule based strategy that helps you determine where price will turn and where price will go with a very high degree of accuracy. So, what is the governing dynamic behind price turns and moves? To figure this out, we must focus on something that is never mentioned in conventional trading education, real buy and sell orders. Price turns (changes direction) at levels where supply and demand is out of balance. It will then move until it reaches a price level where there is another significant supply and demand imbalance.
So, what does a supply and demand imbalance that causes price to turn look like on a price chart? To answer this question, many would quickly start talking about candlestick patterns and formations and also include volume. Most people suggest focusing on price levels where there was a turn in the past and to watch for heavy, above average volume. This is where the focus gets off track in my opinion. Think about it, at price levels where supply and demand are most out of balance which creates the highest probability price turn, is there going to be lots of trading activity or very little? Like anything in life, the more unbalanced an equation or two competing forces are, the quicker and more predictable the outcome is. In a market, the more out of balance supply and demand is at a price level, the less the trading activity will be. What this picture looks like on a price chart is not heavy trading activity and above average volume like all the trading education promotes, it’s actually the opposite.
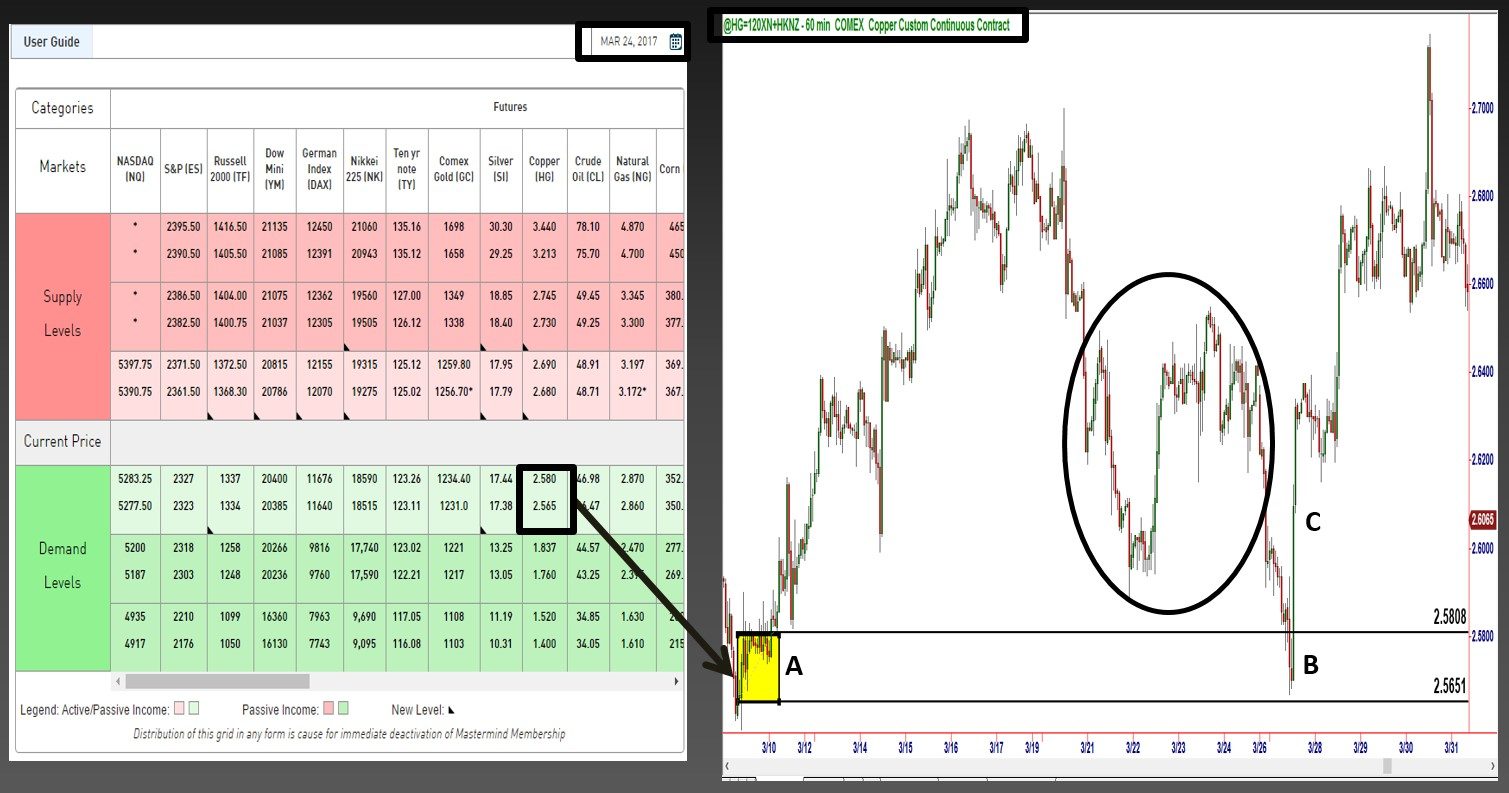
To illustrate what I am talking about, let’s look at a trading idea that was given to our students from our OTA Supply and Demand Grid from March 24th. “A” represents demand (banks buying) as we have a “Drop – Base – Rally” which shows demand exceeds supply. “B” is the time to buy as you are buying from a seller who is selling at wholesale prices, just before price is most likely to rally. “C” is the profitable price rally for those who took the trade during that live trading session. However, notice the circled area on the chart.
Conventional Technical Analysis would suggest you should not buy at “B” because there is so much trading activity above which will make a price rally challenging. Many traders would look at all that trading activity in the circled area and not buy at “B” because they would not think price could rally through that area. Again, to me, the focus and understanding is way off. The fact that there was so much trading activity in that circled area tells me price is very likely to move through that level and should do so with ease, after we buy at “B”. If supply and demand were really that much out of balance in that circled area, you would not have so much trading activity. Price proceeded to move through that area after “B” which was expected if you were focused on the right logic, where the buy and sell orders are and where they are not.
OTA Supply/Demand Grid 3/24/17 – Natural Gas
In summary, the major price turns in a market don’t typically happen at price levels where there is lots of trading activity, it’s the opposite. When looking for this on a price chart, don’t focus on levels surrounded by lots of pretty candles. The focus should be on price action mainly surrounded by white space and understanding why that white space is there in the first place.
So why has this fact that people can’t see the truth about price action puzzled me for so long? Because when you break a solution to a challenge down logically, the answer is typically so simple, Occam’s Razor. My trading education provided by experience on the trading floor years ago dealing with order flow from banks, institutions, money managers, and so on made this basic concept I am writing about today very clear for me. All I did was train my eye to see this on a price chart which now allows me to share the information with you.
Hope this was helpful, have a great day.
Note: All information on this page is subject to change. The use of this website constitutes acceptance of our user agreement. Please read our privacy policy and legal disclaimer. Opinions expressed at FXstreet.com are those of the individual authors and do not necessarily represent the opinion of FXstreet.com or its management. Risk Disclosure: Trading foreign exchange on margin carries a high level of risk, and may not be suitable for all investors. The high degree of leverage can work against you as well as for you. Before deciding to invest in foreign exchange you should carefully consider your investment objectives, level of experience, and risk appetite. The possibility exists that you could sustain a loss of some or all of your initial investment and therefore you should not invest money that you cannot afford to lose. You should be aware of all the risks associated with foreign exchange trading, and seek advice from an independent financial advisor if you have any doubts.
Editors’ Picks

EUR/USD hits two-day highs near 1.1820
EUR/USD picks up pace and reaches two-day tops around 1.1820 at the end of the week. The pair’s move higher comes on the back of renewed weakness in the US Dollar amid growing talk that the Fed could deliver an interest rate cut as early as March. On the docket, the flash US Consumer Sentiment improves to 57.3 in February.

GBP/USD reclaims 1.3600 and above
GBP/USD reverses two straight days of losses, surpassing the key 1.3600 yardstick on Friday. Cable’s rebound comes as the Greenback slips away from two-week highs in response to some profit-taking mood and speculation of Fed rate cuts. In addition, hawkish comments from the BoE’s Pill are also collaborating with the quid’s improvement.

USD/JPY drops back below 157.00, as focus shifts to Japan snap election
USD/JPY is back in the red below 157.00 in the Asian session on Friday. The Japanese Yen recovers ground against the US Dollar amid some profit-taking ahead of Japan's snap general election on Sunday. The preliminary reading of the Michigan Consumer Sentiment Index report for February will be released later on Friday.
Editors’ Picks

EUR/USD: US Dollar to remain pressured until uncertainty fog dissipates Premium
The EUR/USD pair lost additional ground in the first week of February, settling at around 1.1820. The reversal lost momentum after the pair peaked at 1.2082 in January, its highest since mid-2021.

Gold: Volatility persists in commodity space Premium
After losing more than 8% to end the previous week, Gold (XAU/USD) remained under heavy selling pressure on Monday and dropped toward $4,400. Although XAU/USD staged a decisive rebound afterward, it failed to stabilize above $5,000.

GBP/USD: Pound Sterling tests key support ahead of a big week Premium
The Pound Sterling (GBP) changed course against the US Dollar (USD), with GBP/USD giving up nearly 200 pips in a dramatic correction.

Bitcoin: The worst may be behind us
Bitcoin (BTC) price recovers slightly, trading at $65,000 at the time of writing on Friday, after reaching a low of $60,000 during the early Asian trading session. The Crypto King remained under pressure so far this week, posting three consecutive weeks of losses exceeding 30%.

Three scenarios for Japanese Yen ahead of snap election Premium
The latest polls point to a dominant win for the ruling bloc at the upcoming Japanese snap election. The larger Sanae Takaichi’s mandate, the more investors fear faster implementation of tax cuts and spending plans.
RECOMMENDED LESSONS
Making money in forex is easy if you know how the bankers trade!
I’m often mystified in my educational forex articles why so many traders struggle to make consistent money out of forex trading. The answer has more to do with what they don’t know than what they do know. After working in investment banks for 20 years many of which were as a Chief trader its second knowledge how to extract cash out of the market.
5 Forex News Events You Need To Know
In the fast moving world of currency markets where huge moves can seemingly come from nowhere, it is extremely important for new traders to learn about the various economic indicators and forex news events and releases that shape the markets. Indeed, quickly getting a handle on which data to look out for, what it means, and how to trade it can see new traders quickly become far more profitable and sets up the road to long term success.
Top 10 Chart Patterns Every Trader Should Know
Chart patterns are one of the most effective trading tools for a trader. They are pure price-action, and form on the basis of underlying buying and selling pressure. Chart patterns have a proven track-record, and traders use them to identify continuation or reversal signals, to open positions and identify price targets.
7 Ways to Avoid Forex Scams
The forex industry is recently seeing more and more scams. Here are 7 ways to avoid losing your money in such scams: Forex scams are becoming frequent. Michael Greenberg reports on luxurious expenses, including a submarine bought from the money taken from forex traders. Here’s another report of a forex fraud. So, how can we avoid falling in such forex scams?
What Are the 10 Fatal Mistakes Traders Make
Trading is exciting. Trading is hard. Trading is extremely hard. Some say that it takes more than 10,000 hours to master. Others believe that trading is the way to quick riches. They might be both wrong. What is important to know that no matter how experienced you are, mistakes will be part of the trading process.
The challenge: Timing the market and trader psychology
Successful trading often comes down to timing – entering and exiting trades at the right moments. Yet timing the market is notoriously difficult, largely because human psychology can derail even the best plans. Two powerful emotions in particular – fear and greed – tend to drive trading decisions off course.