![]() Russ Allen
Russ Allen
Online Trading Academy
We introduced the topic of options and time value in part 1 of this series, and expanded on it in Part 2 and Part 3. Today we’ll continue with a discussion of the effect of volatility on time value.
In the last installment, we showed an image of an option chain for the exchange-traded fund called EFA. We added the blue bar charts within the option chain to show graphically how much time value there was in each option. Here is that diagram:
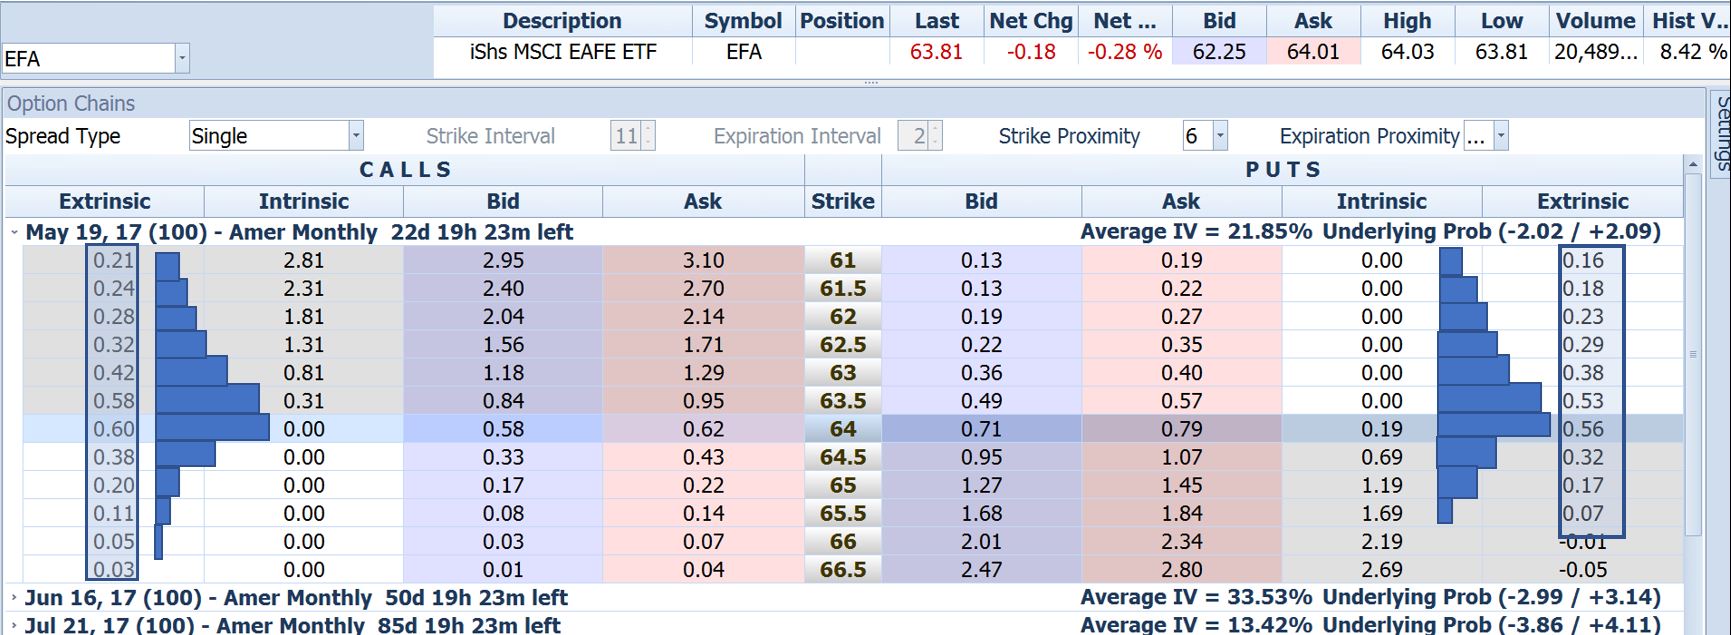
At the time of this screen shot, EFA’s price was at $63.81. The closest strike price to that was at $64, making 64 the “At-the-money” (ATM) strike.
Note the large amount of time value (wider blue bars and larger numbers in the column labeled Extrinsic) for the strike prices closest to the ATM strike, and progressively smaller bars at strike prices farther away from the ATM strike. This illustrates that stock price has a large effect on time value. To further demonstrate that, here is today’s look at EFA’s option chain:

As of this snapshot, the price of EFA had moved up from around $64 to just about $66.00. Notice that in the earlier diagram, the largest amount of time value was at the $64 strike, while in the later one it’s at the $66 strike. As we described before, as the price of EFA changes, you can think of the whole bar chart sliding up and down the chain intact, lining up the widest bar at the strike price nearest the current stock price at all times.
So, time is not the only determinant of time value. Stock price also plays a big part.
With this image of the sliding bar chart in mind, let’s think about the effect of Implied Volatility. This is the name we give to the impact on option prices from changes in market expectations for the stock.
In the second diagram, we see that the Extrinsic (time) value in both the call and the put at the 67 strike is about $.15, give or take a couple of cents. This is the market’s overall or composite opinion about how much they’re willing to pay for the time value in these options. But what if something happens to change that opinion? Let’s say that a story is published that is very negative for EFA, so that people suddenly come to believe that EFA’s price is likely to drop sharply?
In that case, many people would want to buy Put options on EFA. Some of them would be protecting their existing EFA positions. Others would be buying them as a speculation, looking to profit from the drop in the stock (and therefore a rise in the value of the puts which they’d sell later at a profit). All this sudden demand would push up the price of the puts.
As we know, the value of any option consists only of two components – Intrinsic value and Extrinsic value. The intrinsic value part of the option’s value is affected by only one thing – the stock’s actual price. The intrinsic value component cannot expand in the face of demand for an option where the actual stock price has not yet changed. Only the Extrinsic value portion of an option’s price can expand in response to excess demand for the option itself. Except of course, in the case of out-of-the-money options, which have no intrinsic value, they have only extrinsic value, so clearly that is the only component of their price that could expand.
What happens in the case of sudden excess demand for put options for EFA, is that the Extrinsic value of all EFA puts increases. This ripples through all strikes and all expiration dates for the puts, even though only a few strikes may see increased trading activity. This is because all options at all strikes and expirations must share certain relationships between their prices. These relationships cannot get out of order or there would be arbitrage opportunities (risk-free profit opportunities). You can see now why the list of options is called a chain. A more accurate name might be a chain-link fence. Movement in any part of it is immediately transmitted to every other part of it.
When high demand in any part of the chain leads to higher prices throughout the chain, which it must, that change registers as an increase in implied volatility. That’s because, using the option pricing model, it is possible to calculate that if this option is selling for, say, $1.09, while it is $1 away from the stock price with 23 days to go, then that implies that the buyer expects EFA to change in price at an annual rate of 7.47% over that 23 days. 7.47% is that option’s implied volatility.
If the buyer thought that EFA would move at a rate faster than 7.47%, then he would be willing to pay more than $1.09. If he increases his bid to, say, $1.25, then we could again calculate what that implied in terms of his price expectation. It might now imply that he believed that an annual rate of 8.5% was possible.
In terms of our diagrams with the blue bar charts, an increase in implied volatility would cause the amount of time value in all puts to expand roughly in proportion to the amount of extrinsic value they had to start with. Those with the greatest time value would get a big boost, and those with less, a smaller one. So, all the blue bars would get wider. This would benefit anyone who owned puts (any puts), and be correspondingly bad news for anyone who was short puts.
The opposite can happen as well. If some uncertainty about the stock is resolved, so that expectations for future price movement of the stock goes down, then all of the puts on the chain would drop in value and all of the blue bars would shrink. This would be bad news for the owners of puts and good news for the exactly equal number of people who were short those puts.
You can think of the blue bar charts constantly expanding and contracting as expectations for the stock’s price movement changes with each new piece of data that could affect the stock.
Meanwhile, the entire bar chart is slowly shrinking due to another separate force, as each passing day reduces the amount of stock price movement that could still happen in the remaining time to expiration.
So now we know that the amount of time value in an option:
-
Increases as the stock’s price moves closer to its strike, and goes down as the stock moves away
-
Increases if expectations for the stock’s movement increase, and decreases in the opposite case
-
And slowly declines with the passage of time
Once we get these concepts sorted out in our heads, trading options becomes easy
This content is intended to provide educational information only. This information should not be construed as individual or customized legal, tax, financial or investment services. As each individual's situation is unique, a qualified professional should be consulted before making legal, tax, financial and investment decisions. The educational information provided in this article does not comprise any course or a part of any course that may be used as an educational credit for any certification purpose and will not prepare any User to be accredited for any licenses in any industry and will not prepare any User to get a job. Reproduced by permission from OTAcademy.com click here for Terms of Use: https://www.otacademy.com/about/terms
Editors’ Picks

EUR/USD hits two-day highs near 1.1820
EUR/USD picks up pace and reaches two-day tops around 1.1820 at the end of the week. The pair’s move higher comes on the back of renewed weakness in the US Dollar amid growing talk that the Fed could deliver an interest rate cut as early as March. On the docket, the flash US Consumer Sentiment improves to 57.3 in February.

GBP/USD reclaims 1.3600 and above
GBP/USD reverses two straight days of losses, surpassing the key 1.3600 yardstick on Friday. Cable’s rebound comes as the Greenback slips away from two-week highs in response to some profit-taking mood and speculation of Fed rate cuts. In addition, hawkish comments from the BoE’s Pill are also collaborating with the quid’s improvement.

USD/JPY drops back below 157.00, as focus shifts to Japan snap election
USD/JPY is back in the red below 157.00 in the Asian session on Friday. The Japanese Yen recovers ground against the US Dollar amid some profit-taking ahead of Japan's snap general election on Sunday. The preliminary reading of the Michigan Consumer Sentiment Index report for February will be released later on Friday.
Editors’ Picks

EUR/USD: US Dollar to remain pressured until uncertainty fog dissipates Premium
The EUR/USD pair lost additional ground in the first week of February, settling at around 1.1820. The reversal lost momentum after the pair peaked at 1.2082 in January, its highest since mid-2021.

Gold: Volatility persists in commodity space Premium
After losing more than 8% to end the previous week, Gold (XAU/USD) remained under heavy selling pressure on Monday and dropped toward $4,400. Although XAU/USD staged a decisive rebound afterward, it failed to stabilize above $5,000.

GBP/USD: Pound Sterling tests key support ahead of a big week Premium
The Pound Sterling (GBP) changed course against the US Dollar (USD), with GBP/USD giving up nearly 200 pips in a dramatic correction.

Bitcoin: The worst may be behind us
Bitcoin (BTC) price recovers slightly, trading at $65,000 at the time of writing on Friday, after reaching a low of $60,000 during the early Asian trading session. The Crypto King remained under pressure so far this week, posting three consecutive weeks of losses exceeding 30%.

Three scenarios for Japanese Yen ahead of snap election Premium
The latest polls point to a dominant win for the ruling bloc at the upcoming Japanese snap election. The larger Sanae Takaichi’s mandate, the more investors fear faster implementation of tax cuts and spending plans.
RECOMMENDED LESSONS
Making money in forex is easy if you know how the bankers trade!
I’m often mystified in my educational forex articles why so many traders struggle to make consistent money out of forex trading. The answer has more to do with what they don’t know than what they do know. After working in investment banks for 20 years many of which were as a Chief trader its second knowledge how to extract cash out of the market.
5 Forex News Events You Need To Know
In the fast moving world of currency markets where huge moves can seemingly come from nowhere, it is extremely important for new traders to learn about the various economic indicators and forex news events and releases that shape the markets. Indeed, quickly getting a handle on which data to look out for, what it means, and how to trade it can see new traders quickly become far more profitable and sets up the road to long term success.
Top 10 Chart Patterns Every Trader Should Know
Chart patterns are one of the most effective trading tools for a trader. They are pure price-action, and form on the basis of underlying buying and selling pressure. Chart patterns have a proven track-record, and traders use them to identify continuation or reversal signals, to open positions and identify price targets.
7 Ways to Avoid Forex Scams
The forex industry is recently seeing more and more scams. Here are 7 ways to avoid losing your money in such scams: Forex scams are becoming frequent. Michael Greenberg reports on luxurious expenses, including a submarine bought from the money taken from forex traders. Here’s another report of a forex fraud. So, how can we avoid falling in such forex scams?
What Are the 10 Fatal Mistakes Traders Make
Trading is exciting. Trading is hard. Trading is extremely hard. Some say that it takes more than 10,000 hours to master. Others believe that trading is the way to quick riches. They might be both wrong. What is important to know that no matter how experienced you are, mistakes will be part of the trading process.
The challenge: Timing the market and trader psychology
Successful trading often comes down to timing – entering and exiting trades at the right moments. Yet timing the market is notoriously difficult, largely because human psychology can derail even the best plans. Two powerful emotions in particular – fear and greed – tend to drive trading decisions off course.