Back in November 2024, the American public were looking forward to a huge economic recovery based on the promises following the re-election of Donald Trump. People were poised for the Trump Bump. However, cycles were already telling a different story. The bull market was already nearly 15 years in from the major low following the 2007 global financial crisis. Important price targets were looming on the radar. Most importantly, little-known cycles were coming into play. Take a look at these charts.

Chart

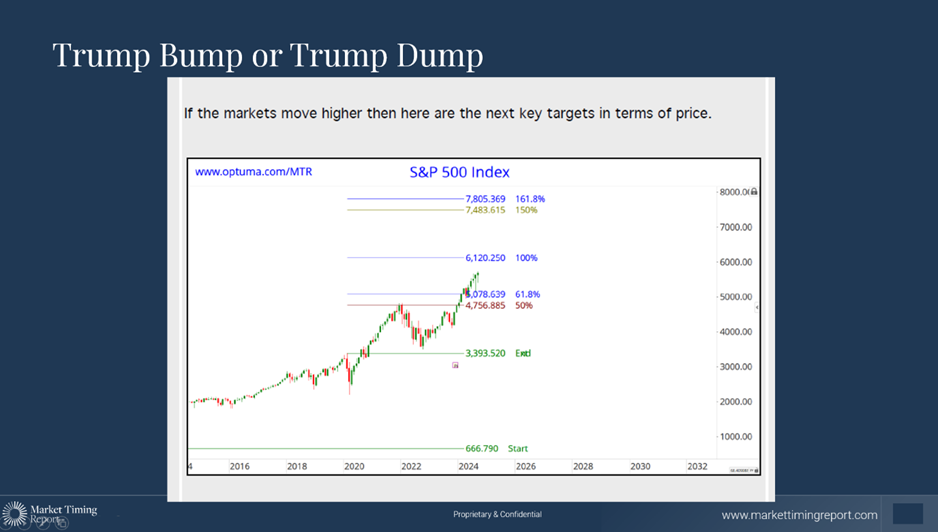
Firstly, a key price target (one that we had been forewarning you about over several months) was rapidly approaching. This is shown in the first chart. Such an important target, for those of you who understand technical analysis, cannot be exceeded without a significant pullback, correction, or even crash. More importantly, take a look at this chart.

Chart

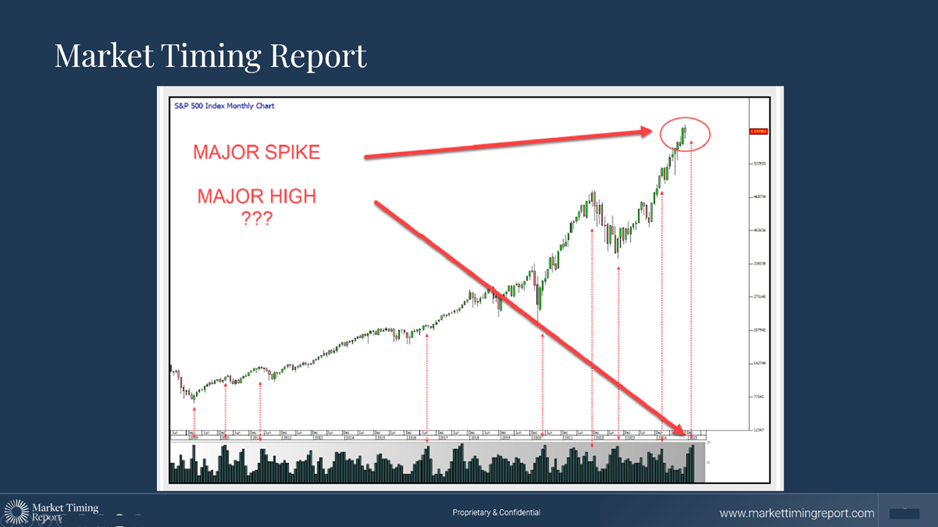
Below this monthly chart of the S&P 500 index, which goes back to 2008, you will see a series of histograms. When these histograms spike, we can expect changes in trend. They are based on market cycles interacting at a high level. If you take a close look, you will see how previous spikes have aligned with significant turning points.

The key benefit of these histogram spikes is that they are predictive—in other words, they are known in advance. As we approached December over the following weeks, we had a very large spike in front of us. This put us on alert for a major trend change.

At the bottom left, you can also see that such a spike identified the beginning of the bull market in 2009. Sentiment at that time was incredibly bearish, with the world having just lived through the global financial crisis.

Sentiment at the time of Trump’s re-election was incredibly bullish.

This bull market had effectively been running since 2009, following the end of the global financial crisis. With the exception of the short pullback in early 2020 (the one that tied in with a 90-year cycle to within six weeks), most people under the age of 35 have not witnessed a proper bear market. That includes some of our professional portfolio manager friends at some of the largest funds in the world.

The purpose of these histograms, and the entire timing system, is to get the odds on your side. This spike is putting us on alert. It does not necessarily forecast a crash. This enabled our followers to take advantage of what not only lay ahead, but also what is coming up next. We are now looking at key price targets, combined with cycles, to provide us with the next opportunity.


The Market Timing Report/Cycles Analysis Ltd is a research company. The information contained herein is for general education purposes and is not intended as specific advice or recommendations to any person or entity. Any reference to a transaction, trade, position, holding, security, market, or level is purely meant to educate readers about possible risks and opportunities in the marketplace and are not meant to imply that any person or entity should take any action whatsoever without first evaluating such action(s) in light of their own situation either on their own or through a professional advisor. If a person or entity does not believe they are qualified to make such decisions, they should seek professional advice. The prices listed are for reference only and are in no way intended to represent an actual trade, entry price or exit price conducted by The Market Timing Report/Cycles Analysis Ltd, portfolios managed by any entity affiliated with The Market Timing Report/Cycles Analysis Ltd or any principal or employee of The Market Timing Report/The Market Timing Report/Cycles Analysis Ltd . This information is not a substitute for professional advice of any nature, including tax, legal, and financial. While we believe the information contained herein to be accurate, all numbers should be verified by the reader through independent sources. Trading securities, options, futures, or any other security involves risk and can result in the immediate and substantial loss of the capital invested.

Editors’ Picks

EUR/USD rebounds after falling toward 1.1700

EUR/USD rebounds after falling toward 1.1700

EUR/USD gains traction and trades above 1.1730 in the American session, looking to end the week virtually unchanged. The bullish opening in Wall Street makes it difficult for the US Dollar to preserve its recovery momentum and helps the pair rebound heading into the weekend.


GBP/USD steadies below 1.3400 as traders assess BoE policy outlook

GBP/USD steadies below 1.3400 as traders assess BoE policy outlook

Following Thursday's volatile session, GBP/USD moves sideways below 1.3400 on Friday. Investors reassess the Bank of England's policy oıtlook after the MPC decided to cut the interest rate by 25 bps by a slim margin. Meanwhile, the improving risk mood helps the pair hold its ground.

USD/JPY rallies to near 157.00 as Yen plunges after BoJ’s policy outcome

USD/JPY rallies to near 157.00 as Yen plunges after BoJ’s policy outcome

The USD/JPY is up 0.85% to near 156.90 during the European trading session. The pair surges as the Japanese Yen underperforms across the board, following the Bank of Japan monetary policy announcement. In the policy meeting, the BoJ raised interest rates by 25 bps to 0.75%, as expected, the highest level seen in three decades.


Editors’ Picks

EUR/USD rebounds after falling toward 1.1700

EUR/USD rebounds after falling toward 1.1700

EUR/USD gains traction and trades above 1.1730 in the American session, looking to end the week virtually unchanged. The bullish opening in Wall Street makes it difficult for the US Dollar to preserve its recovery momentum and helps the pair rebound heading into the weekend.


USD/JPY rallies to near 157.00 as Yen plunges after BoJ’s policy outcome

USD/JPY rallies to near 157.00 as Yen plunges after BoJ’s policy outcome

The USD/JPY is up 0.85% to near 156.90 during the European trading session. The pair surges as the Japanese Yen underperforms across the board, following the Bank of Japan monetary policy announcement. In the policy meeting, the BoJ raised interest rates by 25 bps to 0.75%, as expected, the highest level seen in three decades.

Gold stays below $4,350, looks to post small weekly gains

Gold stays below $4,350, looks to post small weekly gains

Gold struggles to gather recovery momentum and stays below $4,350 in the second half of the day on Friday, as the benchmark 10-year US Treasury bond yield edges higher. Nevertheless, the precious metal remains on track to end the week with modest gains as markets gear up for the holiday season.

Crypto Today: Bitcoin, Ethereum, XRP rebound amid bearish market conditions

Crypto Today: Bitcoin, Ethereum, XRP rebound amid bearish market conditions

Bitcoin (BTC) is edging higher, trading above $88,000 at the time of writing on Monday. Altcoins, including Ethereum (ETH) and Ripple (XRP), are following in BTC’s footsteps, experiencing relief rebounds following a volatile week.

How much can one month of soft inflation change the Fed’s mind?

How much can one month of soft inflation change the Fed’s mind?

One month of softer inflation data is rarely enough to shift Federal Reserve policy on its own, but in a market highly sensitive to every data point, even a single reading can reshape expectations. November’s inflation report offered a welcome sign of cooling price pressures. 

RECOMMENDED LESSONS

5 Forex News Events You Need To Know

In the fast moving world of currency markets where huge moves can seemingly come from nowhere, it is extremely important for new traders to learn about the various economic indicators and forex news events and releases that shape the markets. Indeed, quickly getting a handle on which data to look out for, what it means, and how to trade it can see new traders quickly become far more profitable and sets up the road to long term success.

Top 10 Chart Patterns Every Trader Should Know

Chart patterns are one of the most effective trading tools for a trader. They are pure price-action, and form on the basis of underlying buying and selling pressure. Chart patterns have a proven track-record, and traders use them to identify continuation or reversal signals, to open positions and identify price targets.

7 Ways to Avoid Forex Scams

The forex industry is recently seeing more and more scams. Here are 7 ways to avoid losing your money in such scams: Forex scams are becoming frequent. Michael Greenberg reports on luxurious expenses, including a submarine bought from the money taken from forex traders. Here’s another report of a forex fraud. So, how can we avoid falling in such forex scams?

What Are the 10 Fatal Mistakes Traders Make

Trading is exciting. Trading is hard. Trading is extremely hard. Some say that it takes more than 10,000 hours to master. Others believe that trading is the way to quick riches. They might be both wrong. What is important to know that no matter how experienced you are, mistakes will be part of the trading process.

Strategy

Money Management

Psychology

Best Brokers of 2025