Most Profitable Head and Shoulders Forex Chart Pattern? Top Secret on How to Draw Price Chart Pattern Trendline for Day Trading

Are you always trying to find the most accurate head and shoulders chart pattern or always looking for the correct way on how to draw the proper resistane line/ support line? Let me tell you a secret: the market has a lot of Market Makers or Instutional Traders who set up traps on the version of chart pattern that you are reading with, they know retail traders like reading chart pattern and draw trendlines, and they will force you to close at a price that that you do not want to (hunt for your stop-loss order), thus generally, you need to give extra buffer that the market might not be reacting the way that you think the market should.
Generally speaking, if you are looking for chart pattern to trade, the most consistent, and hence, the most profitable chart pattern is the Butterfly Harmonic Pattern or called Gartley 222 Pattern or ABCD Pattern as well.
There is one simple reason why the ABCD Pattern works better than the other chart pattern. whatever it is Double Top Pattern, Double/ Triple Bottom Pattern, U Shape Bottom, Cup and Handle, Ascending Triange, you name it.
The simple reason is there is a Mathmatics or golden ration guiding how you draw the trendlines in the Butterfly Harmonic Pattern. Yes each trendline/ Price Pattern is required to match the 0.236 0.383 or 0.628 ratio of previous movement, hence it is unlike Hands and Shoulder or Decending Triangle that you can connect whatever Bottoms you feel like as the market support line.
and yes, there are some Simple Math which works behind the market. so stop draw non-math backed resistant and support line that gives ambiguous signal, and follow us to learn how simple Math is workling implicitly in side the market so that you can consistently win from the market at www.gannexplained.com
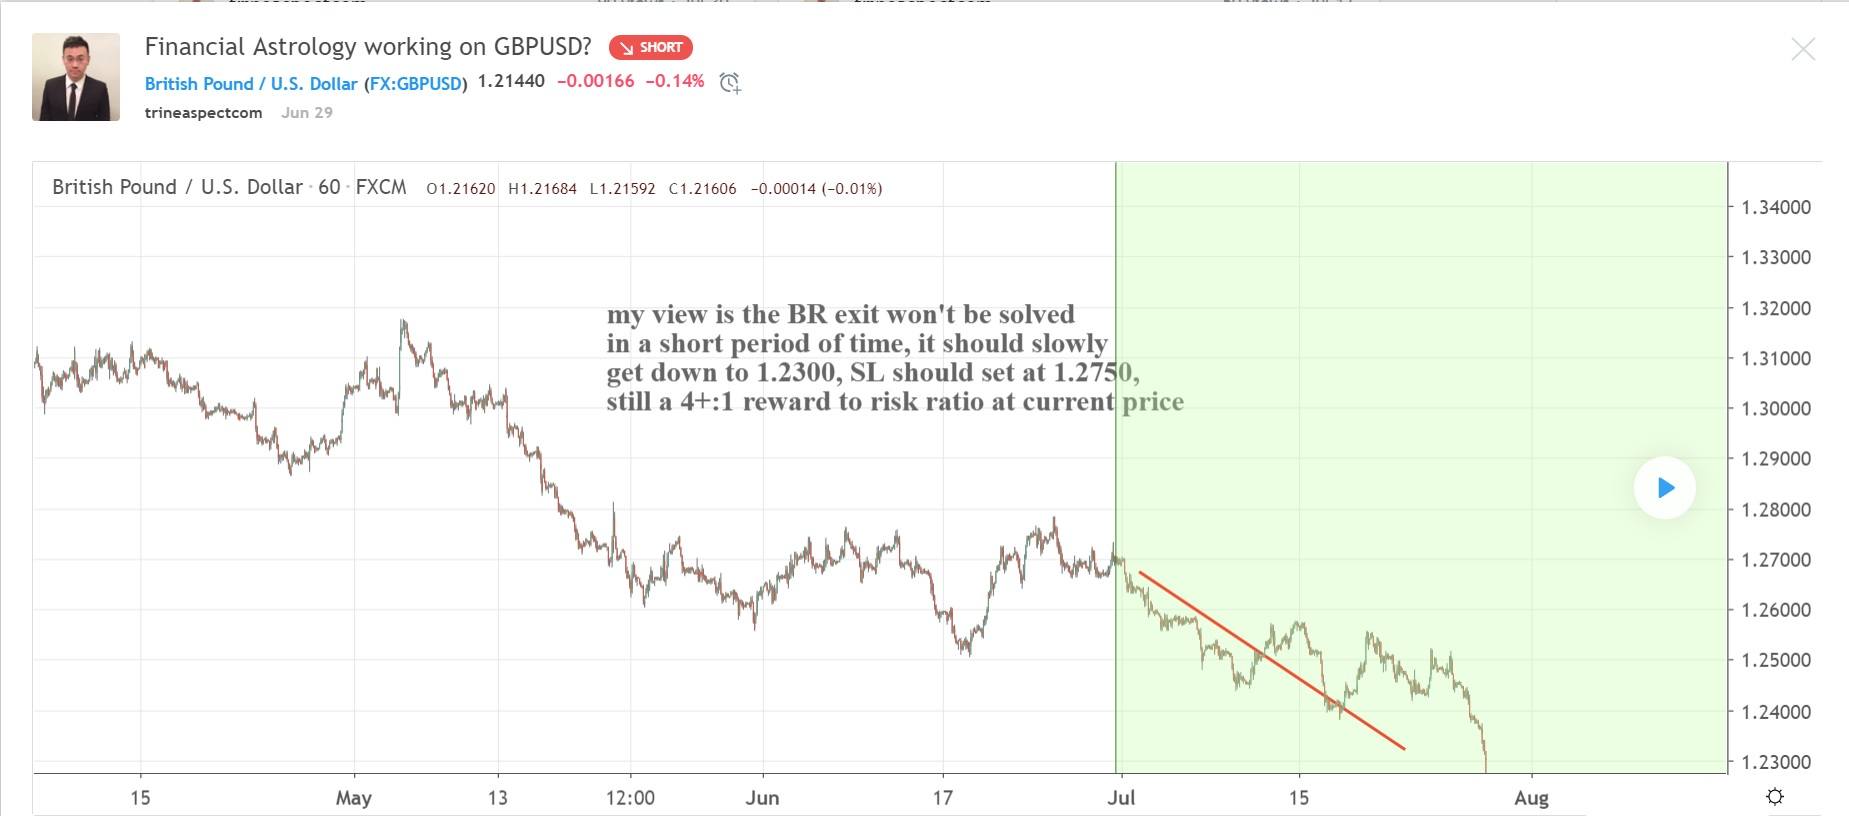
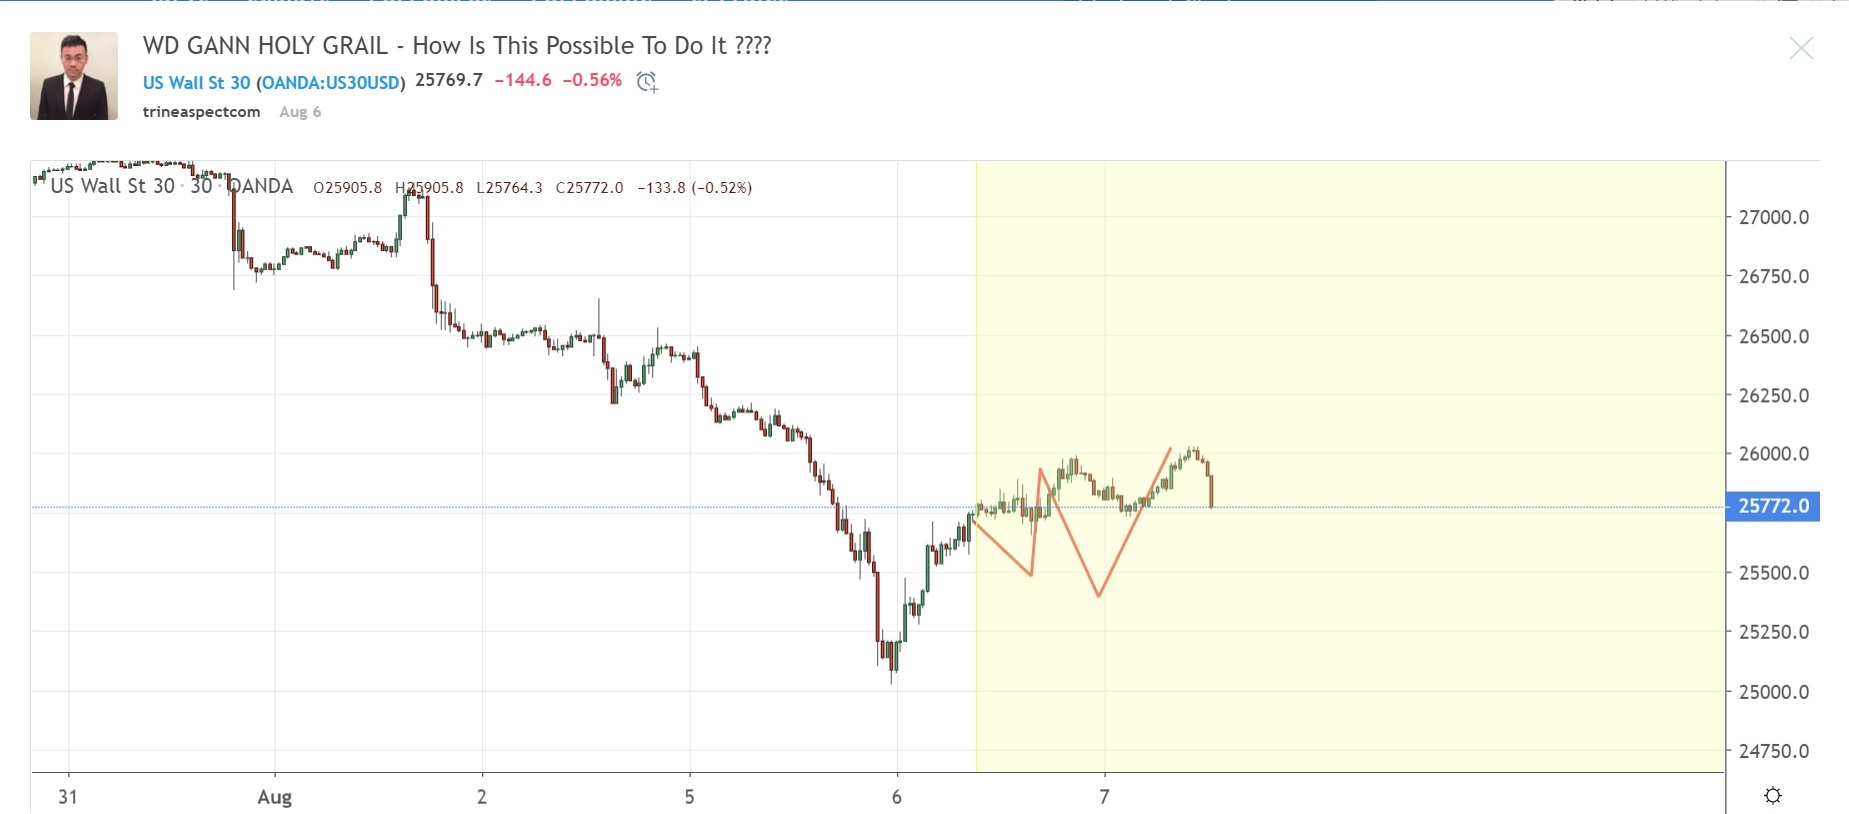
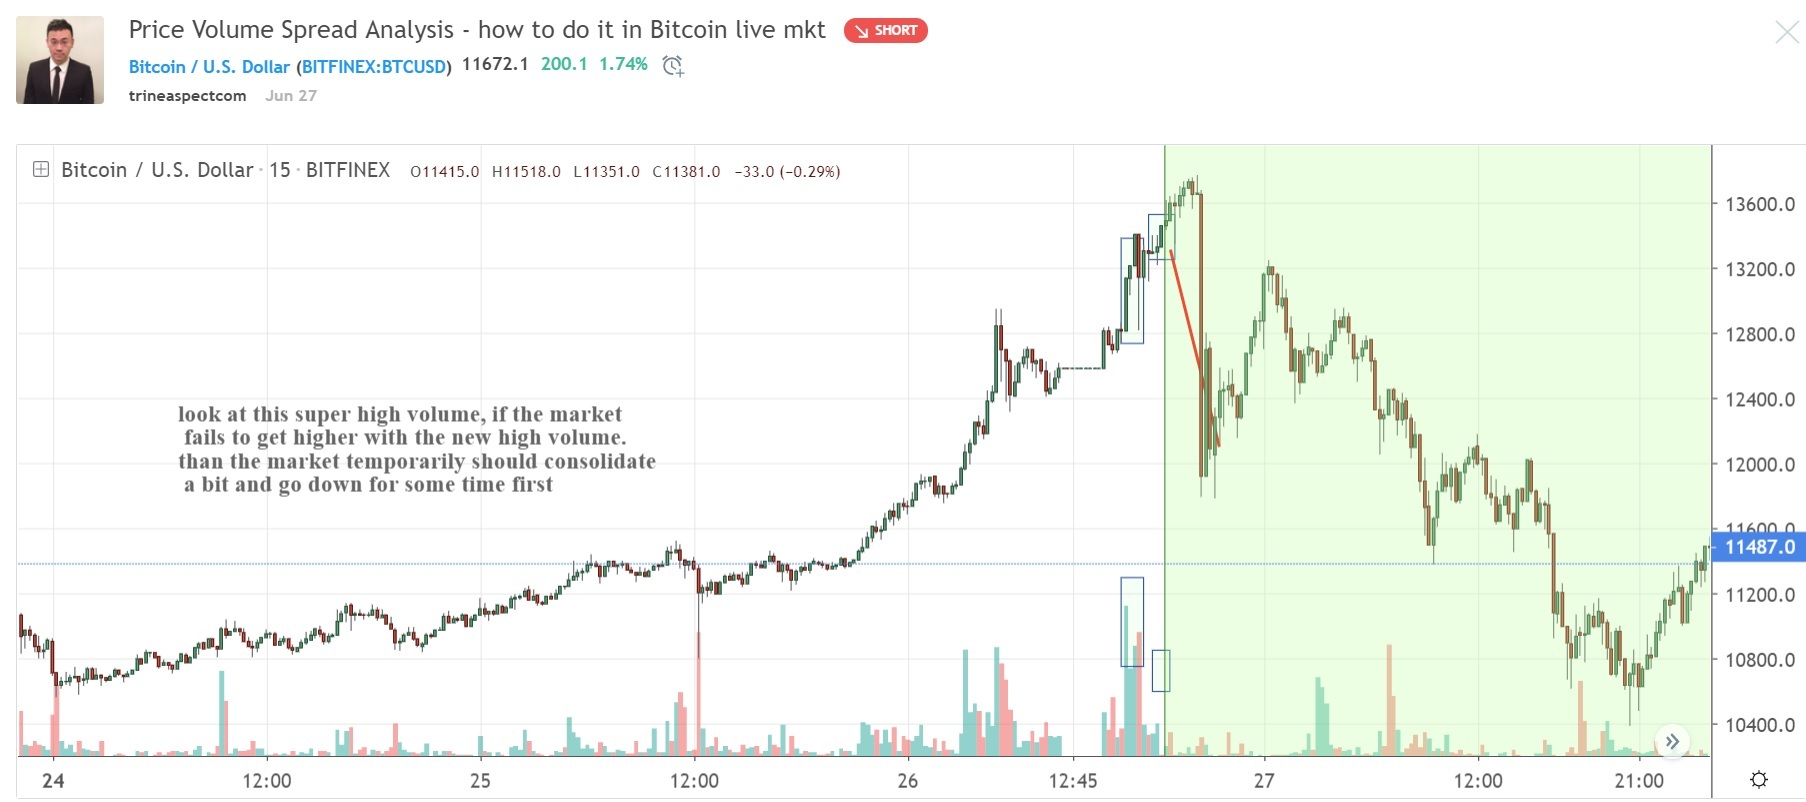
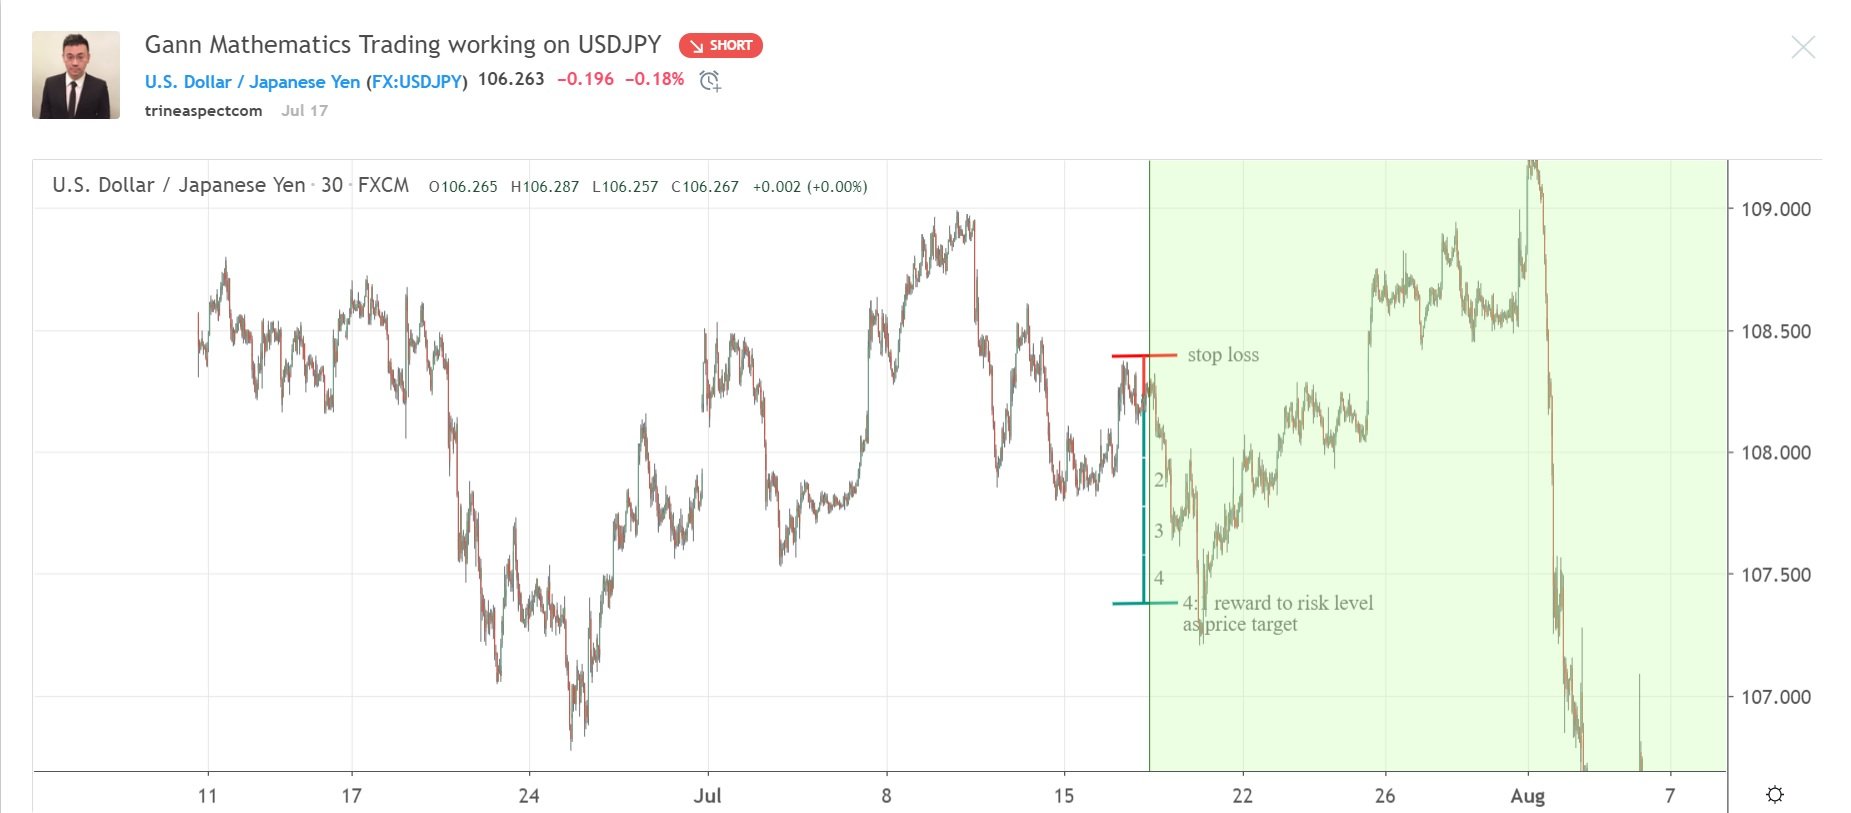
There are some of the real time wd gann math predictions that we have done in the last quarter. the red line being the forecast we suggested, the green section is the real time market reaction after the forecast was posted.
SEND an email with subject "Math Trading FXT" to [email protected] to learn how this market actaully implicitly reacts to the market (it is not golden ratio & fibonacci, wd gann mathematics sequences not every trader already knew!)
which every trader already knows!)
Author

Khit Wong
Gann Explained
As a noted expert on FXStreet.com and in “Technical Analysis of Stocks & Commodities” and "Traders World," I specialize in applying W.D. Gann's complex theories to practical trading.


