![]() Gabe Velázquez
Gabe Velázquez
Online Trading Academy
What Are Micro E-Mini Equity Index Futures?
This week, the CME (Chicago Mercantile Exchange) launched Micro E-mini Equity Index Futures. These are smaller versions of the popular E-Mini products that have been around since 1997. This is a strategic move being made because of the dramatic increase in the notional value of the original contracts, which has made trading E-Mini products somewhat onerous for the average retail trader in terms of volatility and margin requirements. In an effort to lessen the burden and make trading Equity Index Futures more accessible to a larger population of traders, the CME has created this pint-sized version of the original product.
The new contracts will track the four major Stock indices: S&P 500, Nasdaq 100, Dow Jones Industrial Average and The Russell 2000 small cap index. A Micro E-mini Equity Index Futures contract will be one tenth the size of their big brethren.
How to Calculate the Notional Value of Micro E-Mini Equity Index Futures Contracts
Below is an illustration of the multiplier change between the standard E-mini and the new Micro E-Mini contracts.
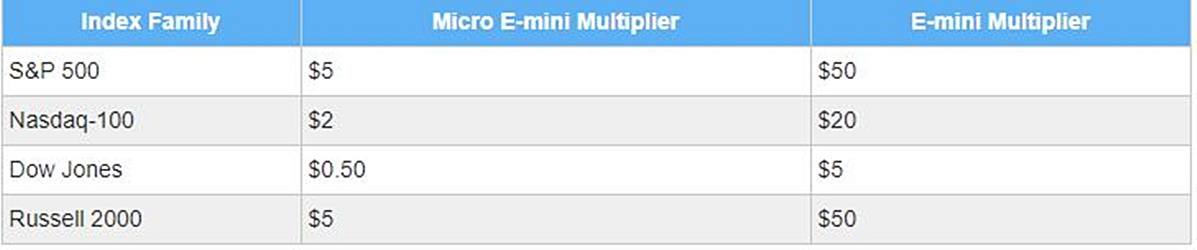
The multiplier is how we calculate the notional value of futures contracts. As of the time of this writing, the value of the E-mini S&P 500 is 2900. If we multiply 2900 by the point value ($50) the value of this contract is $145,000. The Micro contract is reduced to one tenth of that by using a multiplier of $5. This would result in a value of $14,500, making it more palatable to the smaller retail trader.
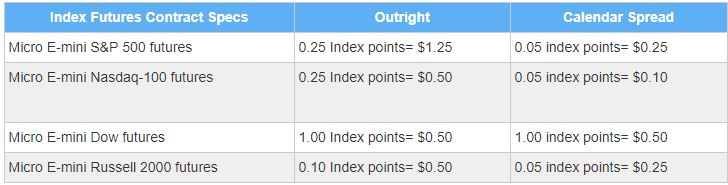
The tick value will correspondingly be one tenth the size on all the Micro contracts as seen below.
Micro E-Mini Equity Index Futures Ticker Symbols:
-
S&P 500 Micro E-mini : MES
-
Nasdaq 100 Micro E-mini : MNQ
-
Dow Jones Micro E-mini : MYM
-
Russell 200 Micro E-mini : M2K
These will be listed on the same quarterly cycle as the standard E-mini contracts : December, March, June, and September. In addition, the trading times will mimic those of the standard E-mini’s as well.
Benefits of Trading Micro E-Mini Equity Index Futures
-
Opens up the opportunity to trade the Stock Index Futures markets to traders that would otherwise not have the funds to do so
-
Could be used to test or learn a strategy with less capital at risk
-
The smaller size could allow more versatility for traders who want to implement longer term strategies, but that the larger contracts may have restricted them from due to the higher risk
-
Will also allow traders to be able to scale (enter and exit positions in increments)
Risks of Trading Micro E-Mini Equity Index Futures
-
Most brokers (at the time of this writing) will charge the same commissions per contract as for standard E-minis, which is roughly $1.25 per side or $2.50 round turn (for the buy and sell) . This means that one would need to have a profit of 2 ticks on every trade in order to break even. This is not a big deal but can have an effect on traders that only trade one of these smaller contracts.
-
The liquidity (the volume of contracts traded) may be a lot less initially which may affect the spreads (bid and ask) and cause slippage on stop market orders.
All and all, these could be a great avenue for traders to execute and practice trading strategies while having a small amount of skin in the game rather than trading on a simulator. This could be a great benefit to many traders. As always, before you start trading these products make sure you understand the stock market and the asset you are trading.
Much success and happy trading, until next time, I hope everyone has a great day.
Read the original article here - Micro E-mini Contracts Explained
This content is intended to provide educational information only. This information should not be construed as individual or customized legal, tax, financial or investment services. As each individual's situation is unique, a qualified professional should be consulted before making legal, tax, financial and investment decisions. The educational information provided in this article does not comprise any course or a part of any course that may be used as an educational credit for any certification purpose and will not prepare any User to be accredited for any licenses in any industry and will not prepare any User to get a job. Reproduced by permission from OTAcademy.com click here for Terms of Use: https://www.otacademy.com/about/terms
Editors’ Picks

EUR/USD hits two-day highs near 1.1820
EUR/USD picks up pace and reaches two-day tops around 1.1820 at the end of the week. The pair’s move higher comes on the back of renewed weakness in the US Dollar amid growing talk that the Fed could deliver an interest rate cut as early as March. On the docket, the flash US Consumer Sentiment improves to 57.3 in February.

GBP/USD reclaims 1.3600 and above
GBP/USD reverses two straight days of losses, surpassing the key 1.3600 yardstick on Friday. Cable’s rebound comes as the Greenback slips away from two-week highs in response to some profit-taking mood and speculation of Fed rate cuts. In addition, hawkish comments from the BoE’s Pill are also collaborating with the quid’s improvement.

USD/JPY drops back below 157.00, as focus shifts to Japan snap election
USD/JPY is back in the red below 157.00 in the Asian session on Friday. The Japanese Yen recovers ground against the US Dollar amid some profit-taking ahead of Japan's snap general election on Sunday. The preliminary reading of the Michigan Consumer Sentiment Index report for February will be released later on Friday.
Editors’ Picks

EUR/USD: US Dollar to remain pressured until uncertainty fog dissipates Premium
The EUR/USD pair lost additional ground in the first week of February, settling at around 1.1820. The reversal lost momentum after the pair peaked at 1.2082 in January, its highest since mid-2021.

Gold: Volatility persists in commodity space Premium
After losing more than 8% to end the previous week, Gold (XAU/USD) remained under heavy selling pressure on Monday and dropped toward $4,400. Although XAU/USD staged a decisive rebound afterward, it failed to stabilize above $5,000.

GBP/USD: Pound Sterling tests key support ahead of a big week Premium
The Pound Sterling (GBP) changed course against the US Dollar (USD), with GBP/USD giving up nearly 200 pips in a dramatic correction.

Bitcoin: The worst may be behind us
Bitcoin (BTC) price recovers slightly, trading at $65,000 at the time of writing on Friday, after reaching a low of $60,000 during the early Asian trading session. The Crypto King remained under pressure so far this week, posting three consecutive weeks of losses exceeding 30%.

Three scenarios for Japanese Yen ahead of snap election Premium
The latest polls point to a dominant win for the ruling bloc at the upcoming Japanese snap election. The larger Sanae Takaichi’s mandate, the more investors fear faster implementation of tax cuts and spending plans.
RECOMMENDED LESSONS
Making money in forex is easy if you know how the bankers trade!
I’m often mystified in my educational forex articles why so many traders struggle to make consistent money out of forex trading. The answer has more to do with what they don’t know than what they do know. After working in investment banks for 20 years many of which were as a Chief trader its second knowledge how to extract cash out of the market.
5 Forex News Events You Need To Know
In the fast moving world of currency markets where huge moves can seemingly come from nowhere, it is extremely important for new traders to learn about the various economic indicators and forex news events and releases that shape the markets. Indeed, quickly getting a handle on which data to look out for, what it means, and how to trade it can see new traders quickly become far more profitable and sets up the road to long term success.
Top 10 Chart Patterns Every Trader Should Know
Chart patterns are one of the most effective trading tools for a trader. They are pure price-action, and form on the basis of underlying buying and selling pressure. Chart patterns have a proven track-record, and traders use them to identify continuation or reversal signals, to open positions and identify price targets.
7 Ways to Avoid Forex Scams
The forex industry is recently seeing more and more scams. Here are 7 ways to avoid losing your money in such scams: Forex scams are becoming frequent. Michael Greenberg reports on luxurious expenses, including a submarine bought from the money taken from forex traders. Here’s another report of a forex fraud. So, how can we avoid falling in such forex scams?
What Are the 10 Fatal Mistakes Traders Make
Trading is exciting. Trading is hard. Trading is extremely hard. Some say that it takes more than 10,000 hours to master. Others believe that trading is the way to quick riches. They might be both wrong. What is important to know that no matter how experienced you are, mistakes will be part of the trading process.
The challenge: Timing the market and trader psychology
Successful trading often comes down to timing – entering and exiting trades at the right moments. Yet timing the market is notoriously difficult, largely because human psychology can derail even the best plans. Two powerful emotions in particular – fear and greed – tend to drive trading decisions off course.