Tron Price Forecast: TRX steadies as Justin Sun invests $18 million in Tron Inc.
- Tron holds above $0.2800 on Tuesday, struggling to surpass the 50-day EMA.
- Justin Sun invests $18 million in Tron Inc. via Black Anthem Limited to boost TRX treasury holdings.
- The technical outlook for Tron remains mixed, with multiple resistances looming overhead.

Tron (TRX) trades above $0.2800 at press time on Monday, hovering below the 50-day Exponential Moving Average (EMA) at $0.2859. Justin Sun, founder of Tron, made an $18 million equity investment in Nasdaq-listed Tron Inc. (previously SRM Entertainment, Inc.) on Monday to boost its TRX treasury holdings further. On the technical side, momentum indicators are turning bullish, but TRX could face multiple overhead resistance levels.
Justin Sun makes an $18 million strategic equity investment
Tron Inc. (Nasdaq: TRON) secured an equity investment from Justin Sun on Monday to expand its TRX treasury portfolio. The $18 million deal was made via Black Anthem Limited at $1.3775 per share. The company has over 677 million TRX tokens (0.716% of total TRX supply) as of Tuesday, valued at over $193 million.

Rich Miller, Chief Executive Officer of Tron Inc., said, “We are aggressively positioning the Company to capitalize on the accelerating adoption of the TRON network, global blockchain-based payments, and Web3 infrastructure. This capital strengthens our balance sheet, expands our digital asset treasury, and enhances our ability to drive substantial long-term shareholder value.”
Tron’s recovery hits a crossroads at the 50-day EMA
Tron's price found support near the $0.2764 level, marked by the November 4 low, on Thursday, resulting in a nearly 2% rebound on Saturday. However, the recovery run faces constant supply dump near the 50-day EMA at $0.2859, resulting in multiple long-tailed Doji candles. Still, the long-legged candles reflect underlying demand, increasing the likelihood of a breakout from the moving average.
A decisive close above $0.2859 could extend the TRX recovery to the 200-day EMA at $0.2944.
The Relative Strength Index (RSI) is at 55 on the daily chart, holding above the midpoint line. This indicates persistent buying pressure despite recent volatility.
At the same time, the Moving Average Convergence Divergence (MACD) crosses above the zero line as the signal line follows the trend, supporting the positive outlook.
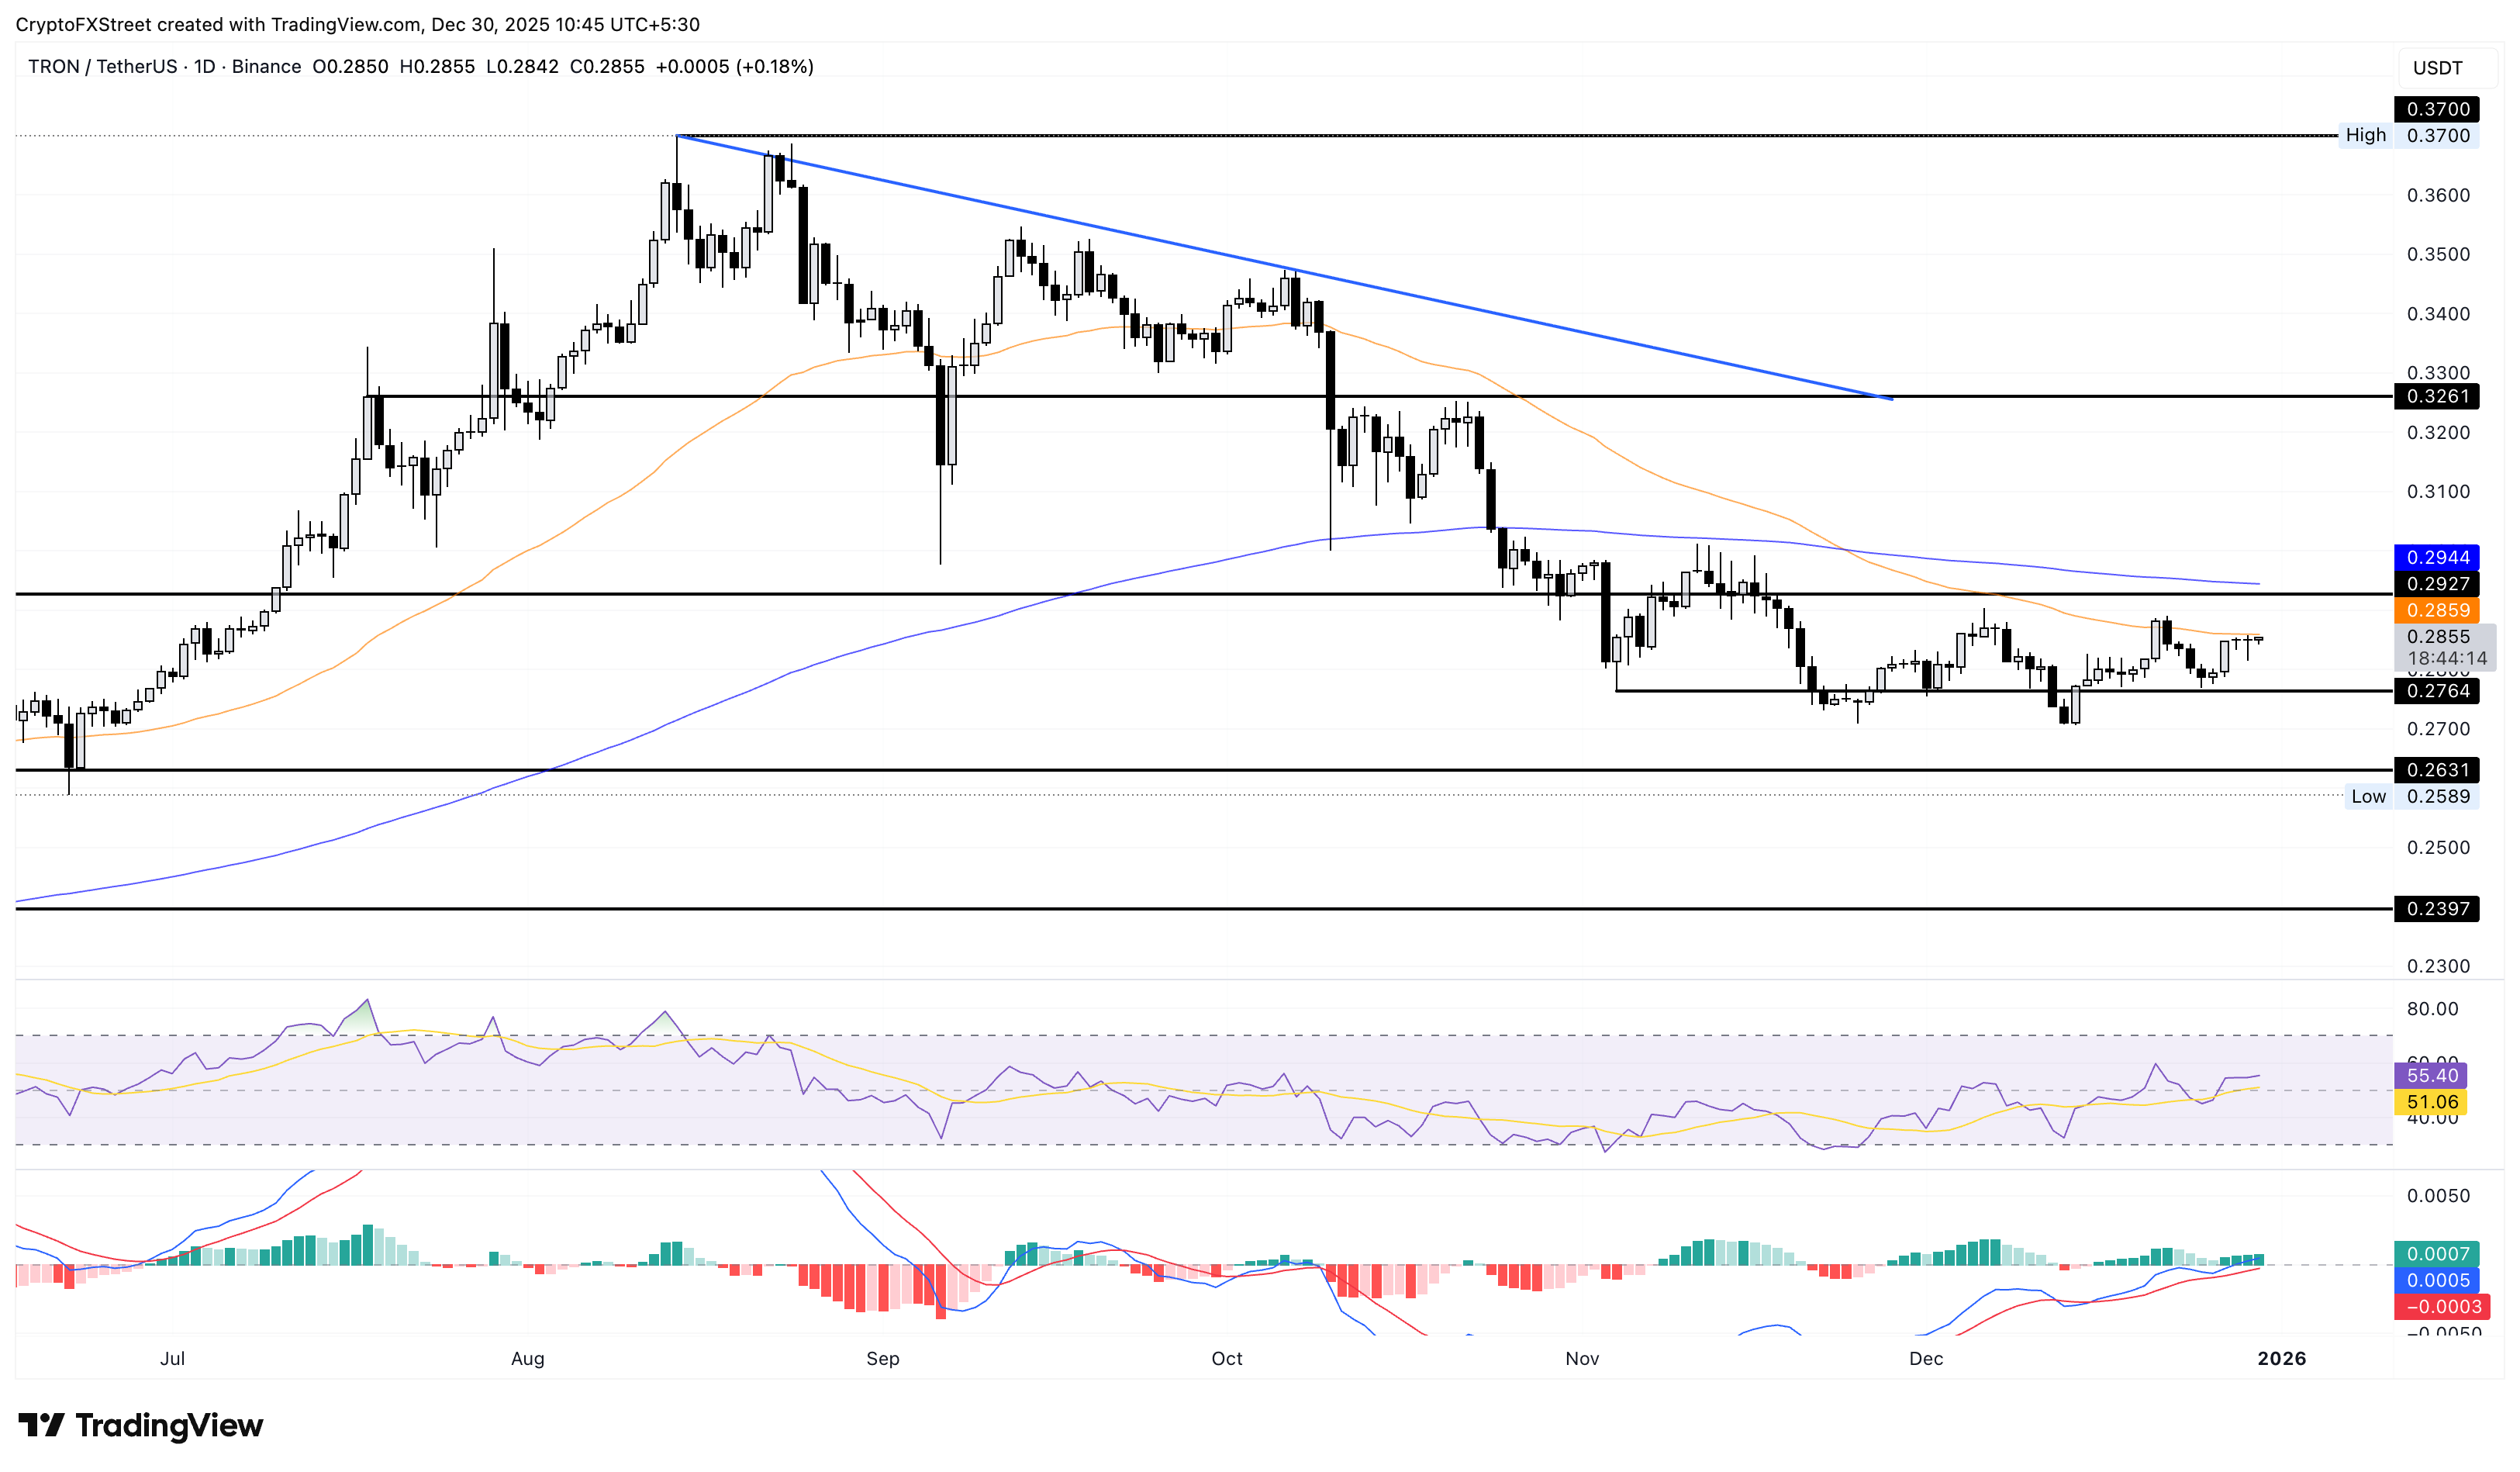
On the flip side, a reversal below $0.2764 would invalidate the short-term recovery chances, targeting the May 31 low at $0.2631.
Author

Vishal Dixit
FXStreet
Vishal Dixit holds a B.Sc. in Chemistry from Wilson College but found his true calling in the world of crypto.