A Brief History Of The Candlestick

Candlesticks were developed by Japanese rice traders nearly 300 years ago.

There are a number of different candlestick patterns which are worth keeping an eye out for, but since we haven’t got 300 years, we’re going to have a look at just one of the top candlesticks patterns for now, which should set you off on the right track.

Introducing The Engulfing Pattern

So say hello to the Engulfing Pattern, which is when the second candlestick ‘engulfs’ the previous candlestick in the opposite direction.

This shows a pure rejection of the previous price action and is a definite sign that the market did not take kindly to the previous move. The engulfing pattern can therefore be both a Bearish reversal signal (if spotted at the top of an uptrend) or a Bullish one (if at the bottom of a downtrend).

Bullish Engulfing

A Bullish Engulfing candlestick pattern is when an initial downward candlestick (close lower than open) is immediately followed by an upward (close higher than open) candlestick that is bigger than it, or entirely engulfs it, that is to say the low is equal to or lower than the previous low, the high is higher than the previous high, and the close is higher than the previous open.

Take a look at these charts to help you better understand what we’re talking about.


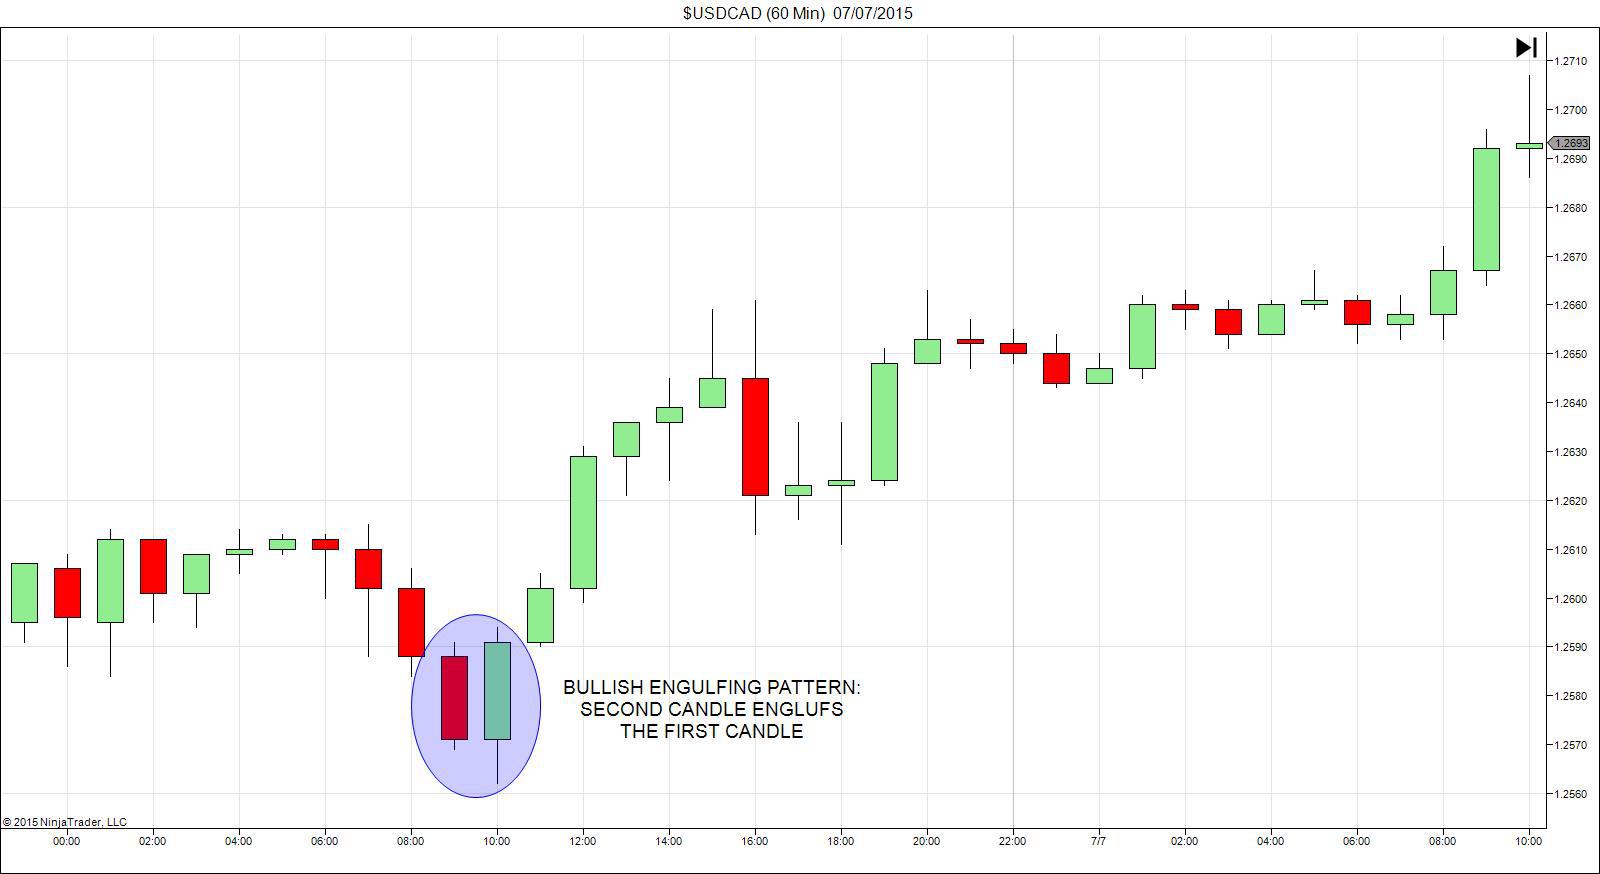
This essentially means that from a supply and demand point of view, the buyers have stepped into the market to ensure it doesn’t drop any lower. This could then result in a push higher as the buyers overwhelm the sellers. Therefore, it can be taken as a Bullish signal.

Bearish Engulfing

The Bearish Signal is simply the opposite of this, as seen below.


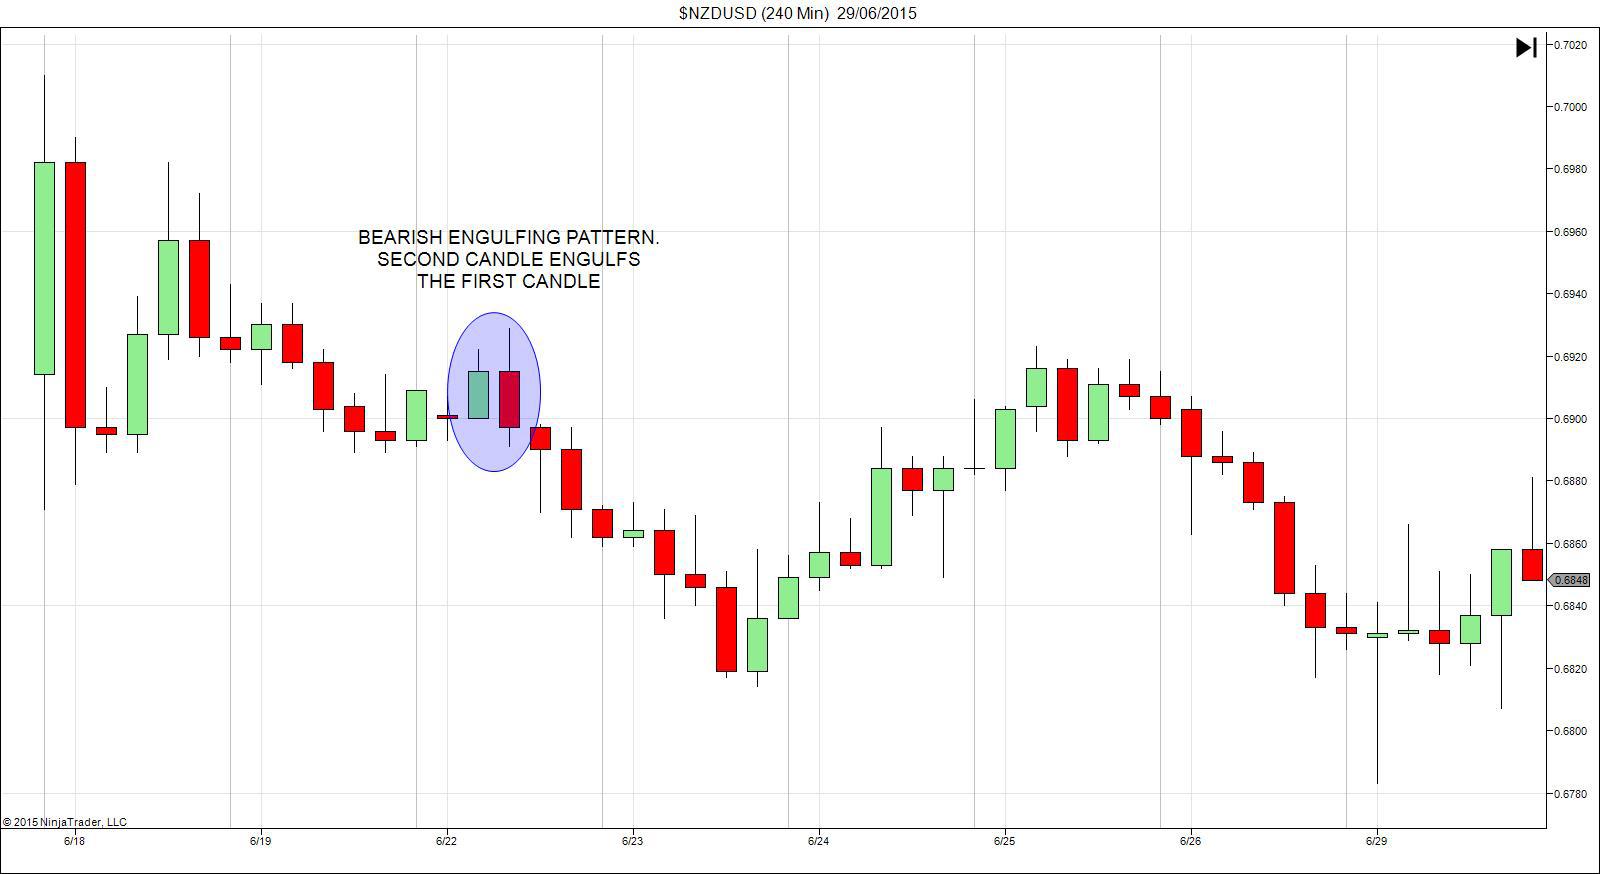
This is a great pattern to look out for and is very effective in two forms, at bottoms and tops looking for turning points, which is relatively high risk, or for trend continuation patterns.

Engulfing In A Strategy

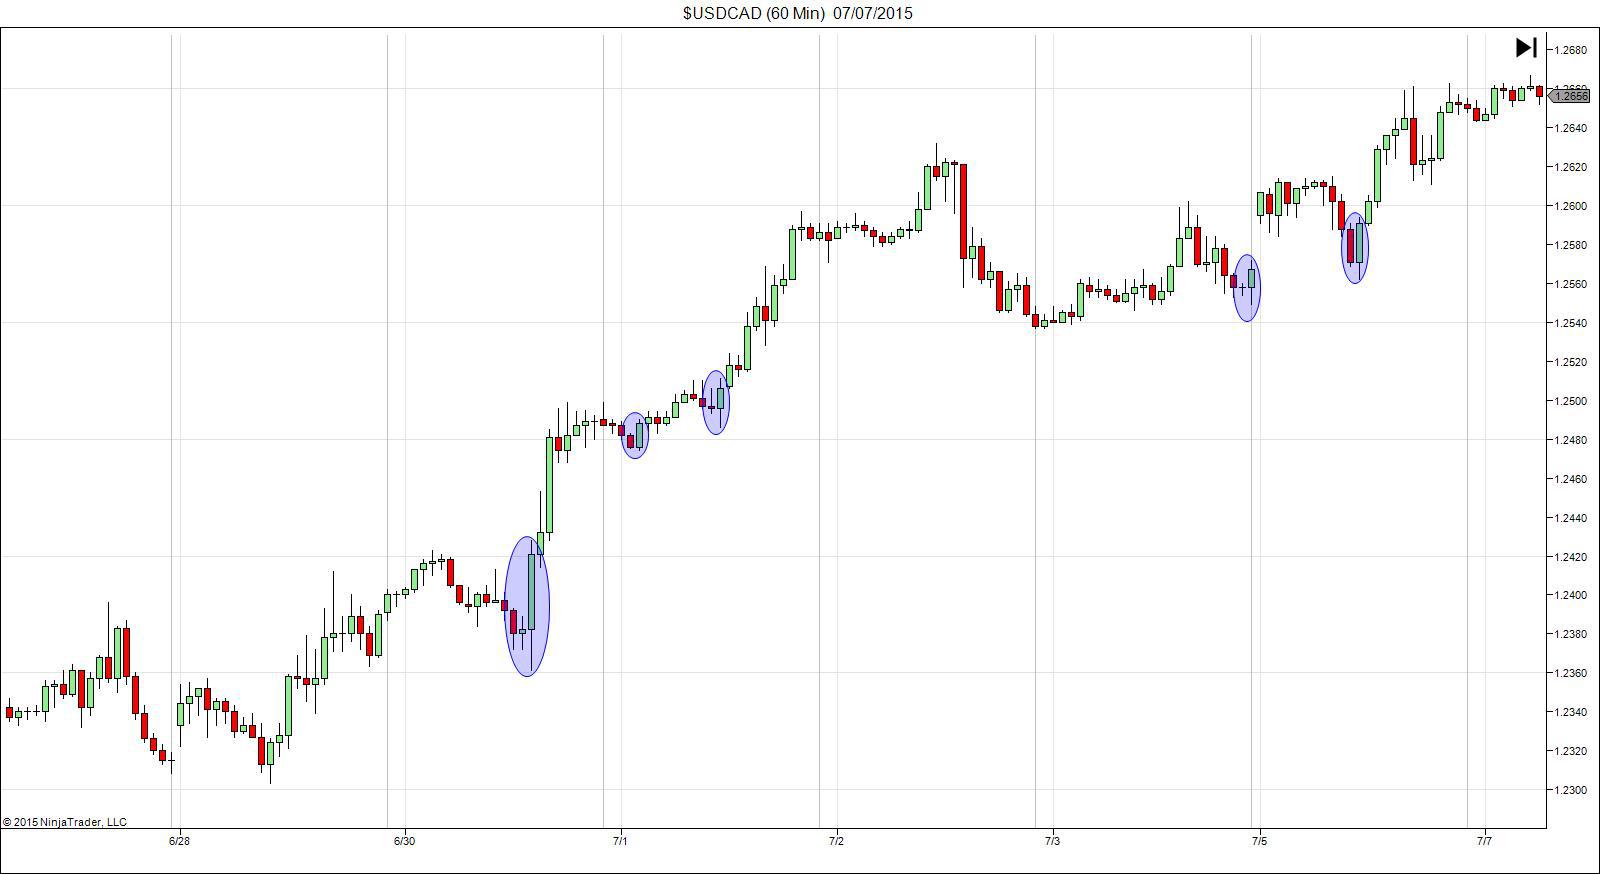
A really nice trading strategy is to look for Bullish engulfing signals in uptrends and Bearish engulfing patterns in downtrends, as they can be good signs of trend continuation.

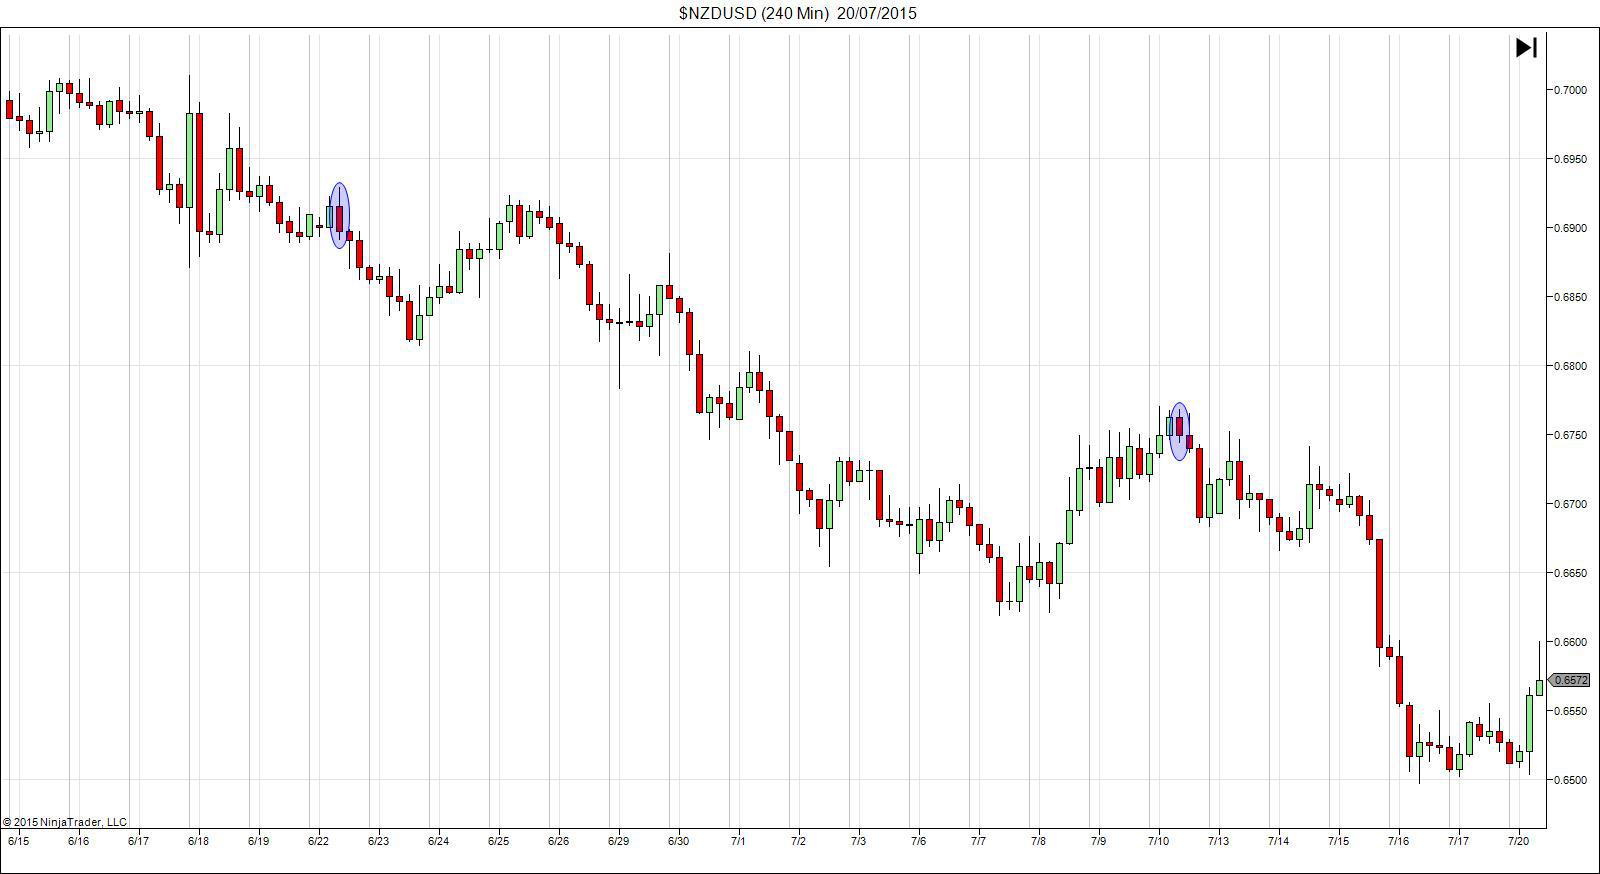
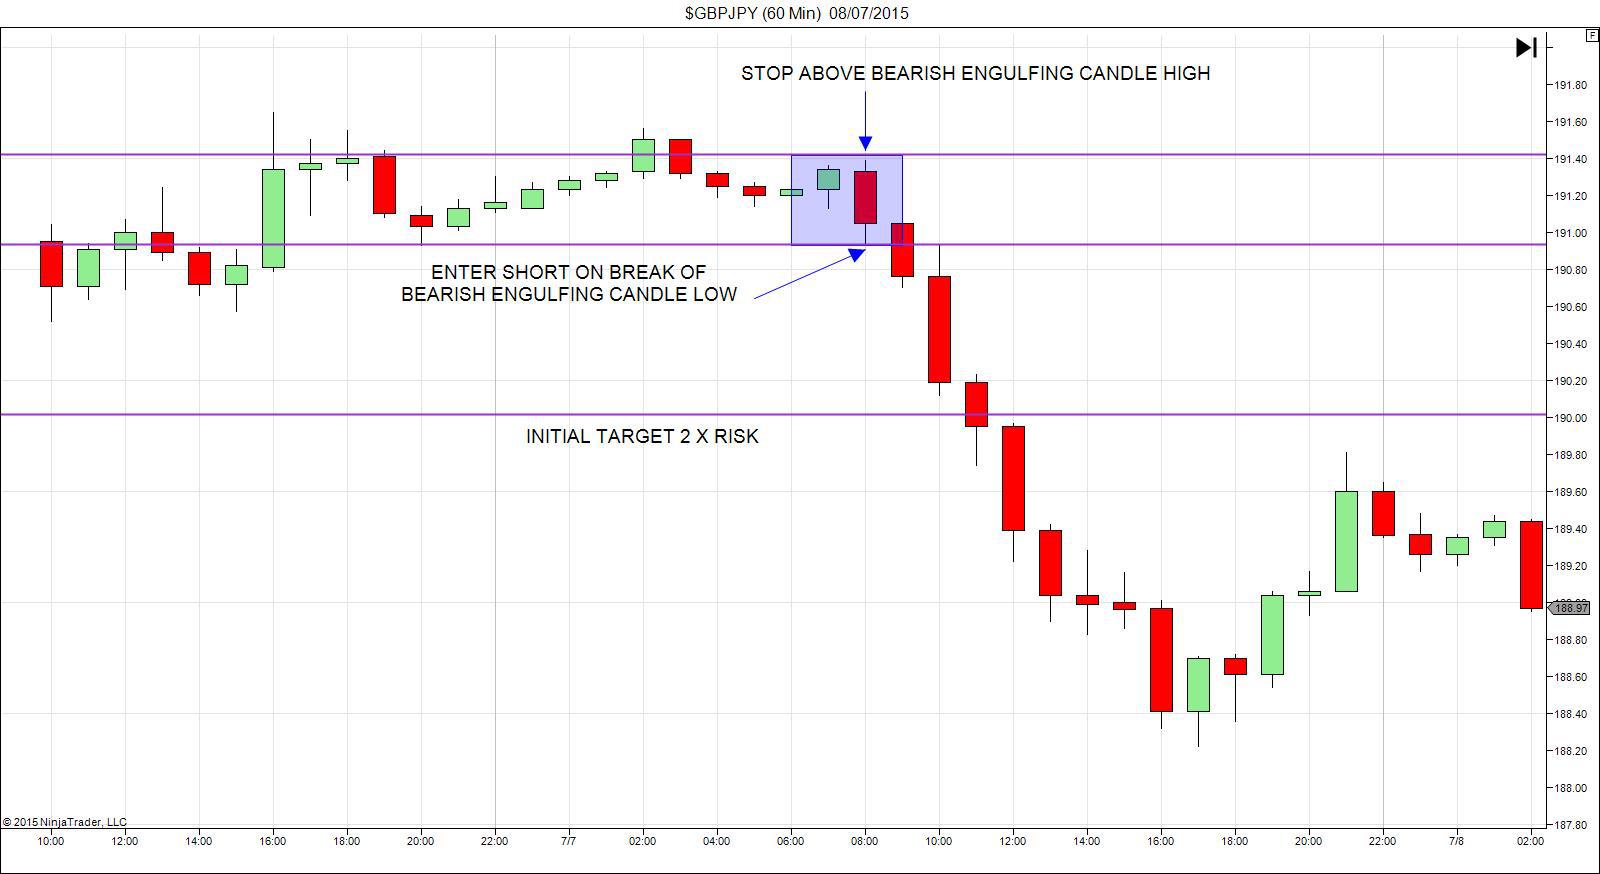
Like Pin Bars, the real trick to this is to look for obvious signals, the ones that really stand out. For instance, if you have an overall downtrend but have recently retraced higher, you will then get a nice Bearish engulfing which could be a great entry to join the trend lower.

As in the Pin Bar strategy, what we want to look for is the ability to place the stop above the Bearish engulfing high or below the Bullish engulfing low, and then look for at least 2:1 risk reward for the trend continuation.


All comments, charts and analysis on this website are purely provided to demonstrate our own personal thoughts and views of the market and should in no way be treated as recommendations or advice. Please do not trade based solely on any information provided within this site, always do your own analysis.

Editors’ Picks

EUR/USD hits two-day highs near 1.1820

EUR/USD hits two-day highs near 1.1820

EUR/USD picks up pace and reaches two-day tops around 1.1820 at the end of the week. The pair’s move higher comes on the back of renewed weakness in the US Dollar amid growing talk that the Fed could deliver an interest rate cut as early as March. On the docket, the flash US Consumer Sentiment improves to 57.3 in February.

GBP/USD reclaims 1.3600 and above

GBP/USD reclaims 1.3600 and above

GBP/USD reverses two straight days of losses, surpassing the key 1.3600 yardstick on Friday. Cable’s rebound comes as the Greenback slips away from two-week highs in response to some profit-taking mood and speculation of Fed rate cuts. In addition, hawkish comments from the BoE’s Pill are also collaborating with the quid’s improvement.

USD/JPY drops back below 157.00, as focus shifts to Japan snap election

USD/JPY drops back below 157.00, as focus shifts to Japan snap election

USD/JPY is back in the red below 157.00 in the Asian session on Friday. The Japanese Yen recovers ground against the US Dollar amid some profit-taking ahead of Japan's snap general election on Sunday. The preliminary reading of the Michigan Consumer Sentiment Index report for February will be released later on Friday. 


Editors’ Picks

EUR/USD: US Dollar to remain pressured until uncertainty fog dissipates

EUR/USD: US Dollar to remain pressured until uncertainty fog dissipates Premium

The EUR/USD pair lost additional ground in the first week of February, settling at around 1.1820. The reversal lost momentum after the pair peaked at 1.2082 in January, its highest since mid-2021.

Gold: Volatility persists in commodity space

Gold: Volatility persists in commodity space Premium

After losing more than 8% to end the previous week, Gold (XAU/USD) remained under heavy selling pressure on Monday and dropped toward $4,400. Although XAU/USD staged a decisive rebound afterward, it failed to stabilize above $5,000.

GBP/USD: Pound Sterling tests key support ahead of a big week

GBP/USD: Pound Sterling tests key support ahead of a big week Premium

The Pound Sterling (GBP) changed course against the US Dollar (USD), with GBP/USD giving up nearly 200 pips in a dramatic correction.

Bitcoin: The worst may be behind us

Bitcoin: The worst may be behind us

Bitcoin (BTC) price recovers slightly, trading at $65,000 at the time of writing on Friday, after reaching a low of $60,000 during the early Asian trading session. The Crypto King remained under pressure so far this week, posting three consecutive weeks of losses exceeding 30%.

Three scenarios for Japanese Yen ahead of snap election

Three scenarios for Japanese Yen ahead of snap election Premium

The latest polls point to a dominant win for the ruling bloc at the upcoming Japanese snap election. The larger Sanae Takaichi’s mandate, the more investors fear faster implementation of tax cuts and spending plans. 

RECOMMENDED LESSONS

5 Forex News Events You Need To Know

In the fast moving world of currency markets where huge moves can seemingly come from nowhere, it is extremely important for new traders to learn about the various economic indicators and forex news events and releases that shape the markets. Indeed, quickly getting a handle on which data to look out for, what it means, and how to trade it can see new traders quickly become far more profitable and sets up the road to long term success.

Top 10 Chart Patterns Every Trader Should Know

Chart patterns are one of the most effective trading tools for a trader. They are pure price-action, and form on the basis of underlying buying and selling pressure. Chart patterns have a proven track-record, and traders use them to identify continuation or reversal signals, to open positions and identify price targets.

7 Ways to Avoid Forex Scams

The forex industry is recently seeing more and more scams. Here are 7 ways to avoid losing your money in such scams: Forex scams are becoming frequent. Michael Greenberg reports on luxurious expenses, including a submarine bought from the money taken from forex traders. Here’s another report of a forex fraud. So, how can we avoid falling in such forex scams?

What Are the 10 Fatal Mistakes Traders Make

Trading is exciting. Trading is hard. Trading is extremely hard. Some say that it takes more than 10,000 hours to master. Others believe that trading is the way to quick riches. They might be both wrong. What is important to know that no matter how experienced you are, mistakes will be part of the trading process.

Strategy

Money Management

Psychology

Best Brokers of 2025